
Packaged foods company Conagra Brands (NYSE: CAG) met Wall Streets revenue expectations in Q4 CY2025, but sales fell by 6.8% year on year to $2.98 billion. Its non-GAAP profit of $0.45 per share was 3.2% above analysts’ consensus estimates.
Is now the time to buy Conagra? Find out by accessing our full research report, it’s free for active Edge members.
Conagra (CAG) Q4 CY2025 Highlights:
- Revenue: $2.98 billion vs analyst estimates of $2.98 billion (6.8% year-on-year decline, in line)
- Adjusted EPS: $0.45 vs analyst estimates of $0.44 (3.2% beat)
- Adjusted EBITDA: $477.9 million vs analyst estimates of $428.5 million (16% margin, 11.5% beat)
- Management reiterated its full-year Adjusted EPS guidance of $1.78 at the midpoint
- Operating Margin: -20.1%, down from 12.6% in the same quarter last year
- Free Cash Flow Margin: 4.7%, down from 12.6% in the same quarter last year
- Organic Revenue fell 3% year on year
- Sales Volumes fell 3% year on year (0.4% in the same quarter last year)
- Market Capitalization: $8.51 billion
Company Overview
Founded in 1919 as Nebraska Consolidated Mills in Omaha, Nebraska, Conagra Brands today (NYSE: CAG) boasts a diverse portfolio of packaged foods brands that includes everything from whipped cream to jarred pickles to frozen meals.
Revenue Growth
A company’s long-term performance is an indicator of its overall quality. Any business can put up a good quarter or two, but the best consistently grow over the long haul.
With $11.23 billion in revenue over the past 12 months, Conagra is one of the larger consumer staples companies and benefits from a well-known brand that influences purchasing decisions. However, its scale is a double-edged sword because there are only so many big store chains to sell into, making it harder to find incremental growth. To accelerate sales, Conagra likely needs to optimize its pricing or lean into new products and international expansion.
As you can see below, Conagra’s demand was weak over the last three years. Its sales fell by 2.3% annually as consumers bought less of its products.
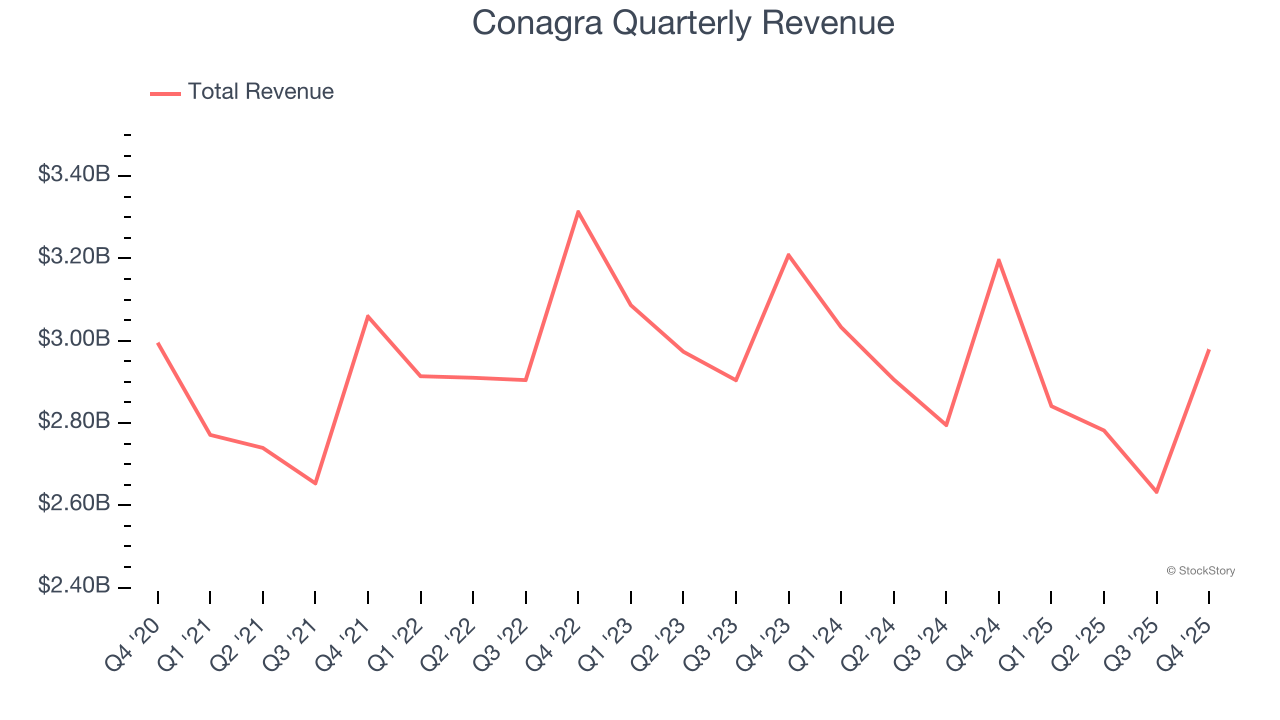
This quarter, Conagra reported a rather uninspiring 6.8% year-on-year revenue decline to $2.98 billion of revenue, in line with Wall Street’s estimates.
Looking ahead, sell-side analysts expect revenue to remain flat over the next 12 months. Although this projection indicates its newer products will catalyze better top-line performance, it is still below average for the sector.
Software is eating the world and there is virtually no industry left that has been untouched by it. That drives increasing demand for tools helping software developers do their jobs, whether it be monitoring critical cloud infrastructure, integrating audio and video functionality, or ensuring smooth content streaming. Click here to access a free report on our 3 favorite stocks to play this generational megatrend.
Volume Growth
Revenue growth can be broken down into changes in price and volume (the number of units sold). While both are important, volume is the lifeblood of a successful staples business as there’s a ceiling to what consumers will pay for everyday goods; they can always trade down to non-branded products if the branded versions are too expensive.
To analyze whether Conagra generated its growth (or lack thereof) from changes in price or volume, we can compare its volume growth to its organic revenue growth, which excludes non-fundamental impacts on company financials like mergers and currency fluctuations.
Over the last two years, Conagra’s average quarterly volumes have shrunk by 1.8%. This isn’t ideal for a consumer staples company, where demand is typically stable. In the context of its 2.6% average organic sales declines, we can see that most of the company’s losses have come from fewer customers purchasing its products.

In Conagra’s Q4 2026, sales volumes dropped 3% year on year. This result represents a further deceleration from its historical levels, showing the business is struggling to move its products.
Key Takeaways from Conagra’s Q4 Results
We liked that although revenue was in line, EPS beat, partly driven by gross margin outperformance vs. Wall Street’s estimates. Overall, this print had some key positives. The stock traded up 1.3% to $18.03 immediately after reporting.
Sure, Conagra had a solid quarter, but if we look at the bigger picture, is this stock a buy? What happened in the latest quarter matters, but not as much as longer-term business quality and valuation, when deciding whether to invest in this stock. We cover that in our actionable full research report which you can read here, it’s free for active Edge members.


