
CSW has followed the market’s trajectory closely, rising in tandem with the S&P 500 over the past six months. The stock has climbed by 8.3% to $305.31 per share while the index has gained 13%.
Is CSW a buy right now? Find out in our full research report, it’s free for active Edge members.
Why Are We Positive On CSW?
With over two centuries of combined operations manufacturing and supplying, CSW (NASDAQ: CSW) offers special chemicals, coatings, sealants, and lubricants for various industries.
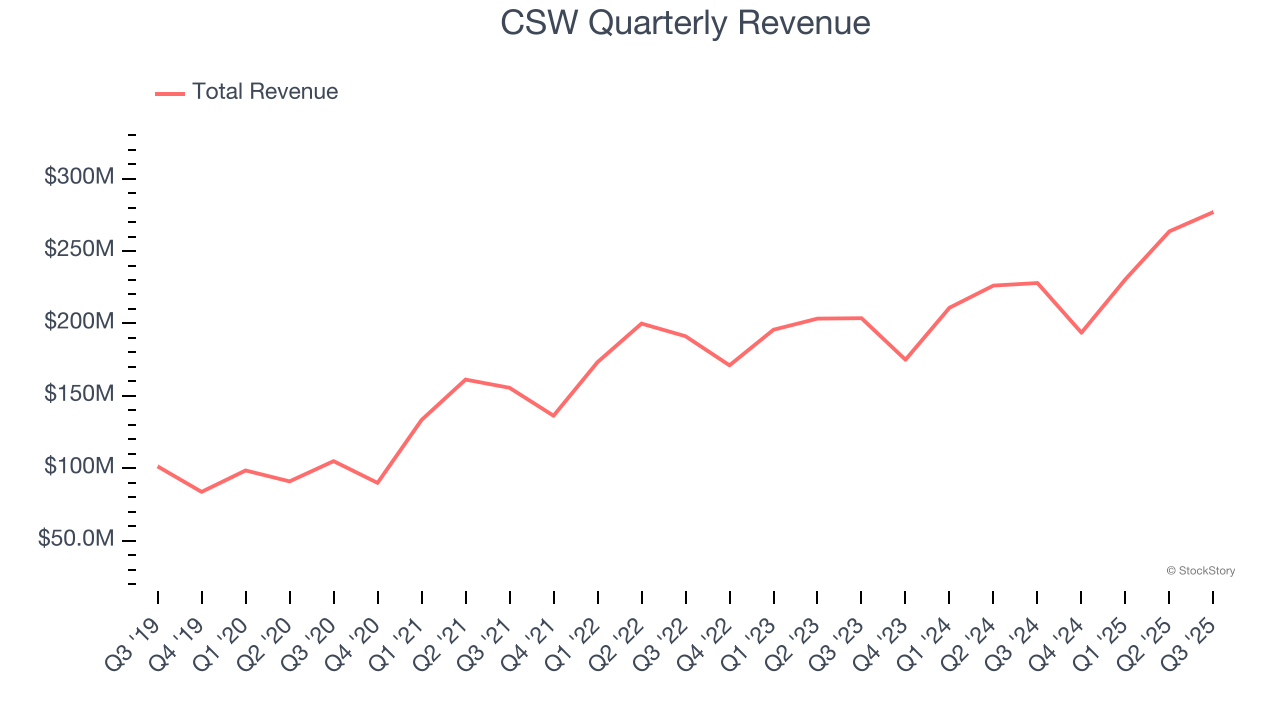
1. Skyrocketing Revenue Shows Strong Momentum
A company’s long-term sales performance is one signal of its overall quality. Even a bad business can shine for one or two quarters, but a top-tier one grows for years. Over the last five years, CSW grew its sales at an incredible 20.6% compounded annual growth rate. Its growth surpassed the average industrials company and shows its offerings resonate with customers.
2. Outstanding Long-Term EPS Growth
We track the long-term change in earnings per share (EPS) because it highlights whether a company’s growth is profitable.
CSW’s EPS grew at an astounding 23.4% compounded annual growth rate over the last five years, higher than its 20.6% annualized revenue growth. This tells us the company became more profitable on a per-share basis as it expanded.

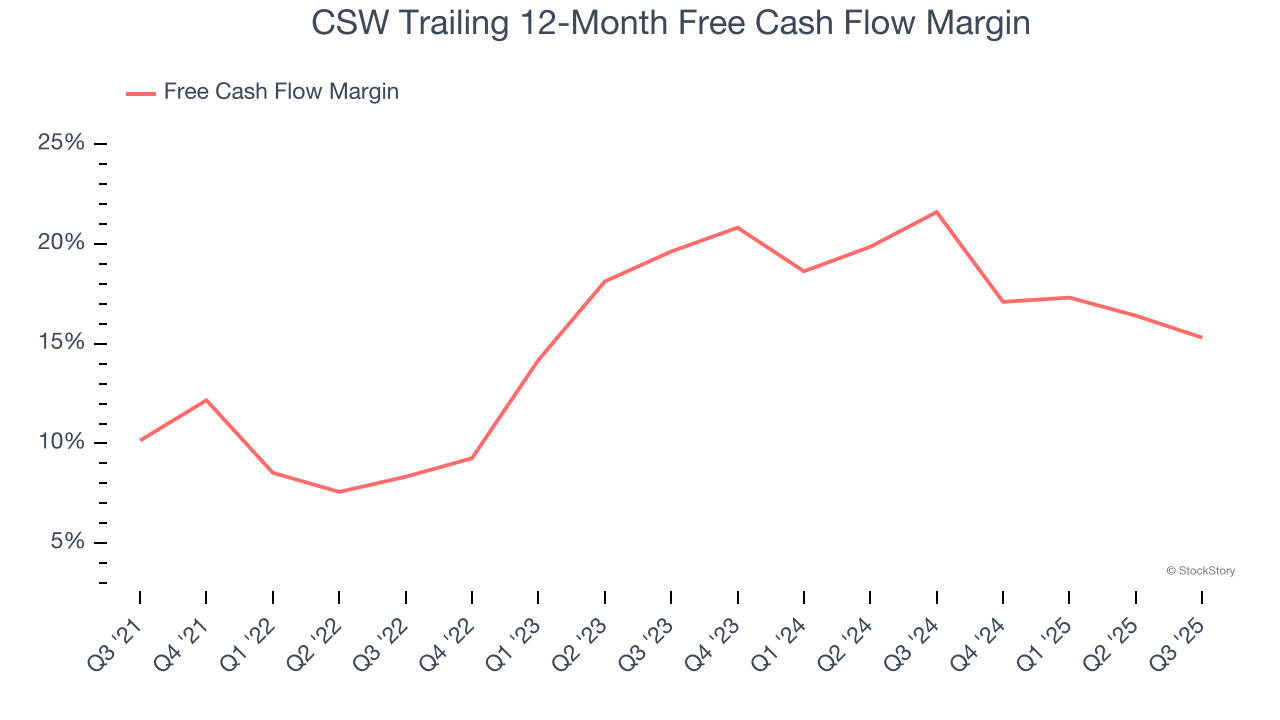
3. Excellent Free Cash Flow Margin Boosts Reinvestment Potential
If you’ve followed StockStory for a while, you know we emphasize free cash flow. Why, you ask? We believe that in the end, cash is king, and you can’t use accounting profits to pay the bills.
CSW has shown terrific cash profitability, putting it in an advantageous position to invest in new products, return capital to investors, and consolidate the market during industry downturns. The company’s free cash flow margin was among the best in the industrials sector, averaging 15.6% over the last five years.
Final Judgment
These are just a few reasons why CSW is a cream-of-the-crop industrials company, but at $305.31 per share (or 26.9× forward P/E), is now the time to initiate a position? See for yourself in our comprehensive research report, it’s free for active Edge members .
High-Quality Stocks for All Market Conditions
If your portfolio success hinges on just 4 stocks, your wealth is built on fragile ground. You have a small window to secure high-quality assets before the market widens and these prices disappear.
Don’t wait for the next volatility shock. Check out our Top 5 Strong Momentum Stocks for this week. This is a curated list of our High Quality stocks that have generated a market-beating return of 244% over the last five years (as of June 30, 2025).
Stocks that have made our list include now familiar names such as Nvidia (+1,326% between June 2020 and June 2025) as well as under-the-radar businesses like the once-small-cap company Comfort Systems (+782% five-year return). Find your next big winner with StockStory today.


