
Although IAC (currently trading at $39.47 per share) has gained 6.3% over the last six months, it has trailed the S&P 500’s 13% return during that period. This was partly driven by its softer quarterly results and might have investors contemplating their next move.
Is now the time to buy IAC, or should you be careful about including it in your portfolio? Check out our in-depth research report to see what our analysts have to say, it’s free for active Edge members.
Why Do We Think IAC Will Underperform?
We're cautious about IAC. Here are three reasons you should be careful with IAC and a stock we'd rather own.
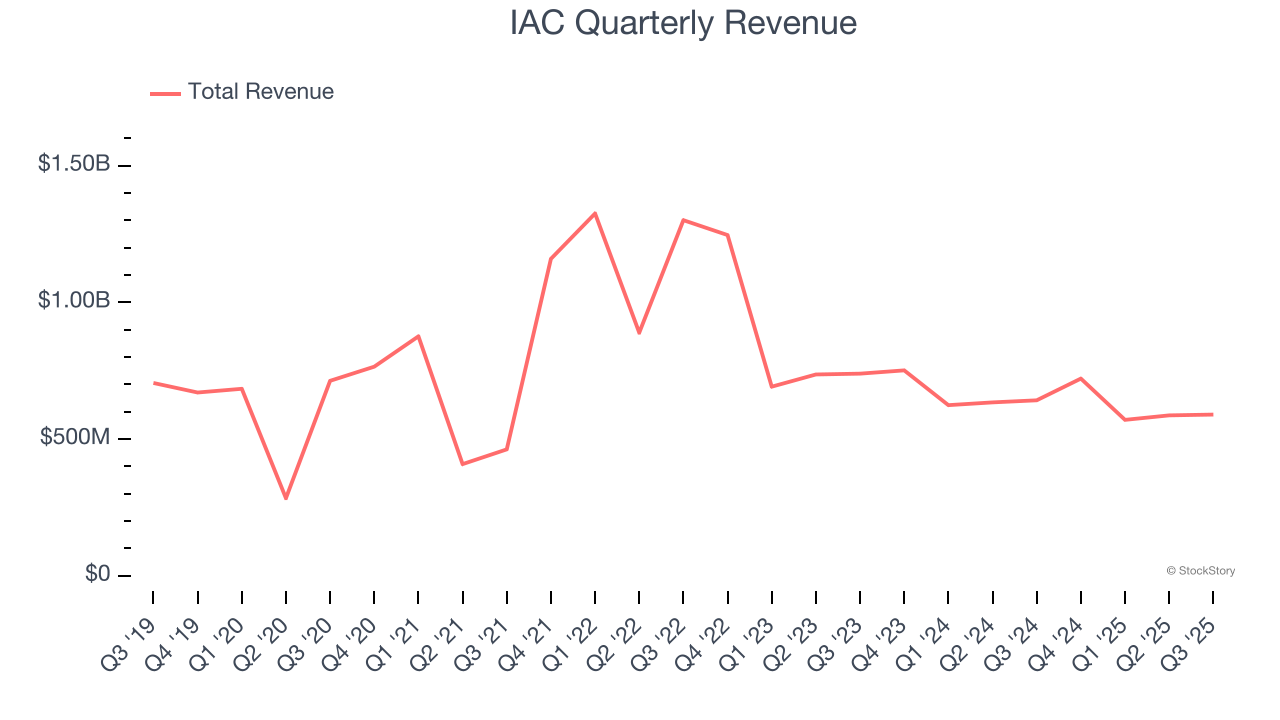
1. Long-Term Revenue Growth Flatter Than a Pancake
A company’s long-term sales performance is one signal of its overall quality. Any business can have short-term success, but a top-tier one grows for years. Unfortunately, IAC struggled to consistently increase demand as its $2.47 billion of sales for the trailing 12 months was close to its revenue five years ago. This was below our standards and is a sign of poor business quality.
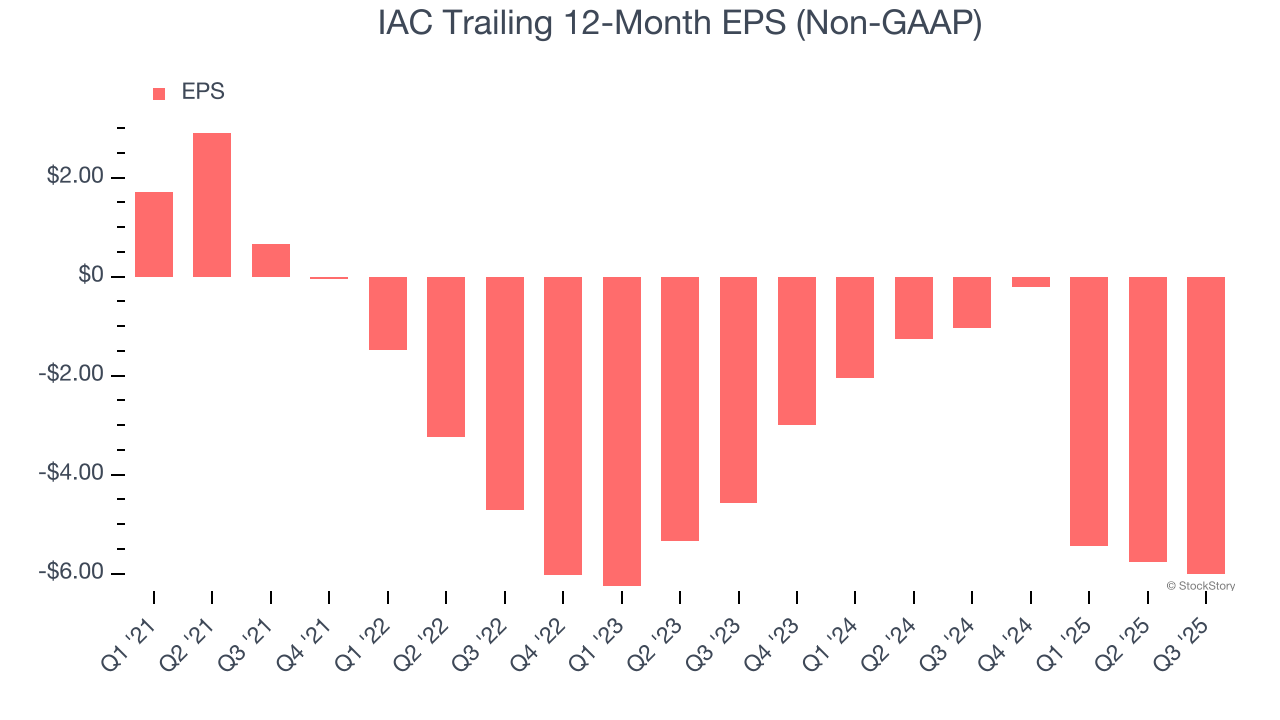
2. EPS Trending Down
We track the long-term change in earnings per share (EPS) because it highlights whether a company’s growth is profitable.
Sadly for IAC, its EPS declined by 19.6% annually over the last five years while its revenue was flat. This tells us the company struggled because its fixed cost base made it difficult to adjust to choppy demand.
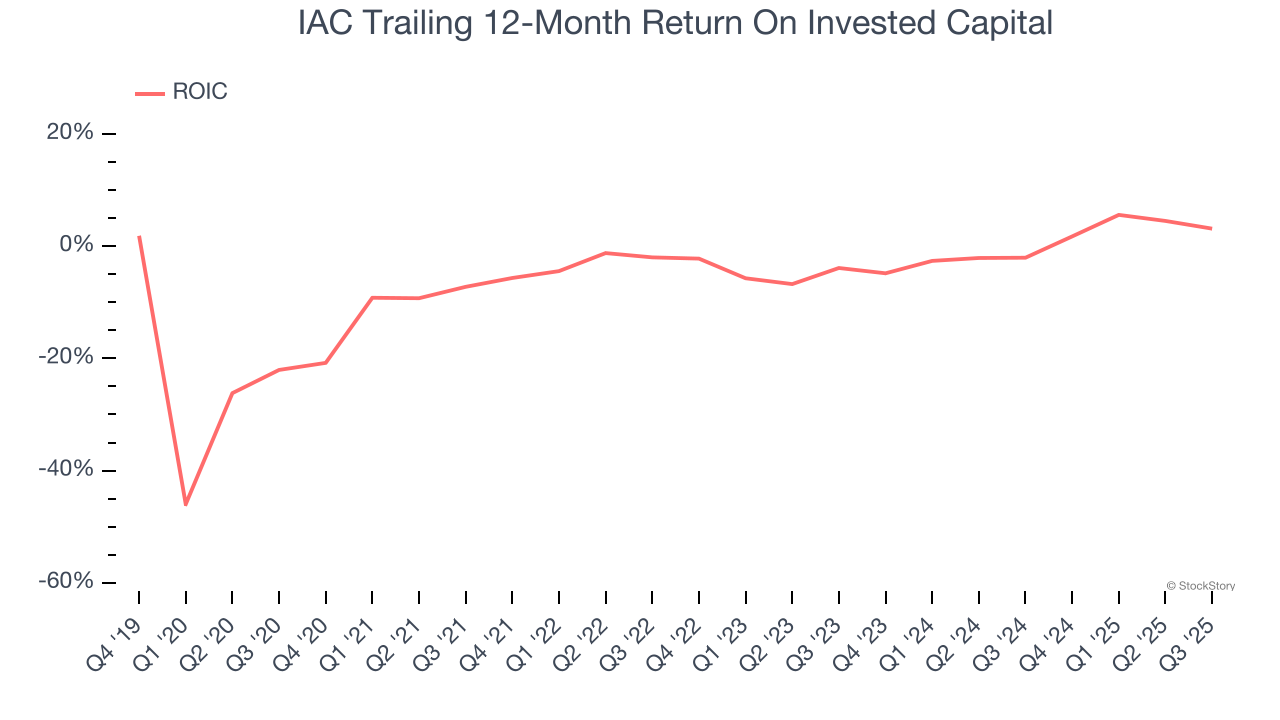
3. Previous Growth Initiatives Have Lost Money
Growth gives us insight into a company’s long-term potential, but how capital-efficient was that growth? Enter ROIC, a metric showing how much operating profit a company generates relative to the money it has raised (debt and equity).
IAC’s five-year average ROIC was negative 2.4%, meaning management lost money while trying to expand the business. Its returns were among the worst in the business services sector.
Final Judgment
IAC falls short of our quality standards. With its shares lagging the market recently, the stock trades at 27.2× forward P/E (or $39.47 per share). This multiple tells us a lot of good news is priced in - we think there are better opportunities elsewhere. We’d recommend looking at one of Charlie Munger’s all-time favorite businesses.
High-Quality Stocks for All Market Conditions
Your portfolio can’t afford to be based on yesterday’s story. The risk in a handful of heavily crowded stocks is rising daily.
The names generating the next wave of massive growth are right here in our Top 5 Strong Momentum Stocks for this week. This is a curated list of our High Quality stocks that have generated a market-beating return of 244% over the last five years (as of June 30, 2025).
Stocks that have made our list include now familiar names such as Nvidia (+1,326% between June 2020 and June 2025) as well as under-the-radar businesses like the once-small-cap company Comfort Systems (+782% five-year return). Find your next big winner with StockStory today.


