
Human capital management company Paychex (NASDAQ: PAYX) met Wall Streets revenue expectations in Q4 CY2025, with sales up 18.3% year on year to $1.56 billion. Its non-GAAP profit of $1.26 per share was 2.4% above analysts’ consensus estimates.
Is now the time to buy Paychex? Find out by accessing our full research report, it’s free for active Edge members.
Paychex (PAYX) Q4 CY2025 Highlights:
- Revenue: $1.56 billion vs analyst estimates of $1.55 billion (18.3% year-on-year growth, in line)
- Adjusted EPS: $1.26 vs analyst estimates of $1.23 (2.4% beat)
- Adjusted EBITDA: $698.4 million vs analyst estimates of $703.1 million (44.8% margin, 0.7% miss)
- Operating Margin: 36.7%, down from 40.9% in the same quarter last year
- Free Cash Flow Margin: 24.6%, down from 43% in the previous quarter
- Market Capitalization: $41.11 billion
Company Overview
Once known as the go-to service for small business payroll needs, Paychex (NASDAQ: PAYX) provides payroll processing, HR services, employee benefits administration, and insurance solutions to small and medium-sized businesses.
Revenue Growth
A company’s long-term performance is an indicator of its overall quality. Any business can experience short-term success, but top-performing ones enjoy sustained growth for years. Regrettably, Paychex’s sales grew at a sluggish 8.7% compounded annual growth rate over the last five years. This was below our standard for the software sector and is a rough starting point for our analysis.
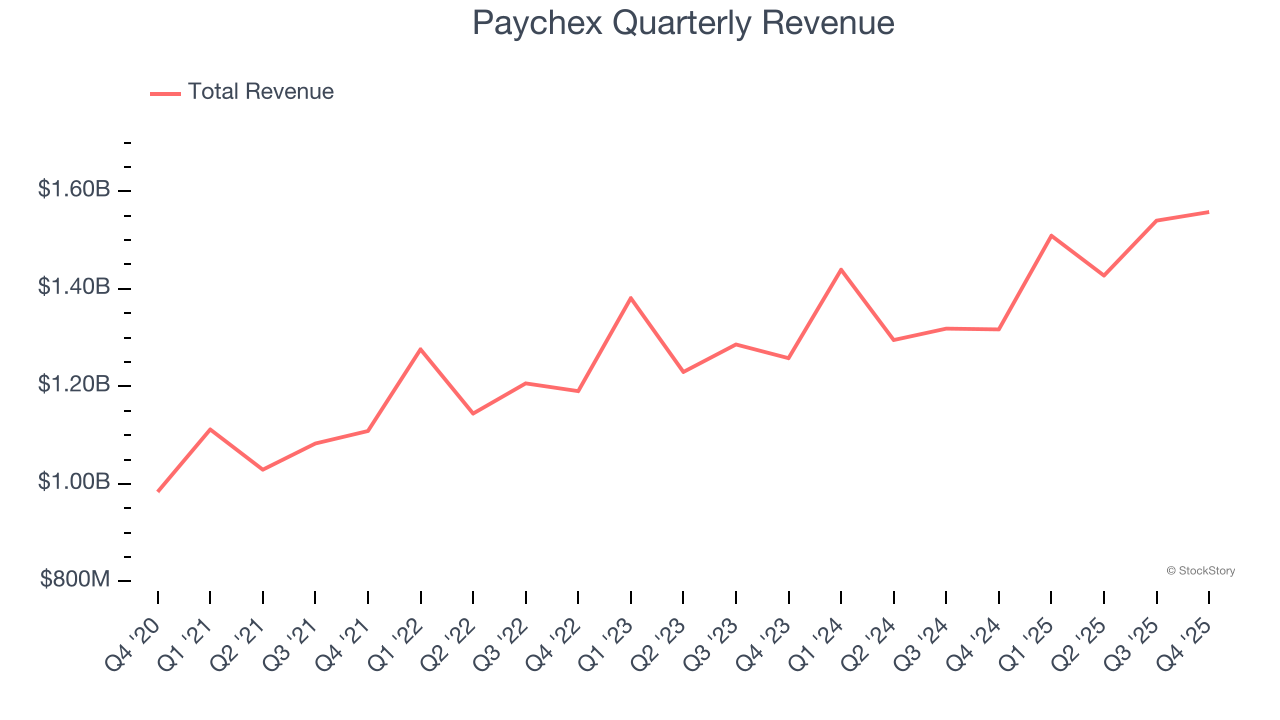
We at StockStory place the most emphasis on long-term growth, but within software, a half-decade historical view may miss recent innovations or disruptive industry trends. Paychex’s annualized revenue growth of 8.2% over the last two years aligns with its five-year trend, suggesting its demand was consistently weak. 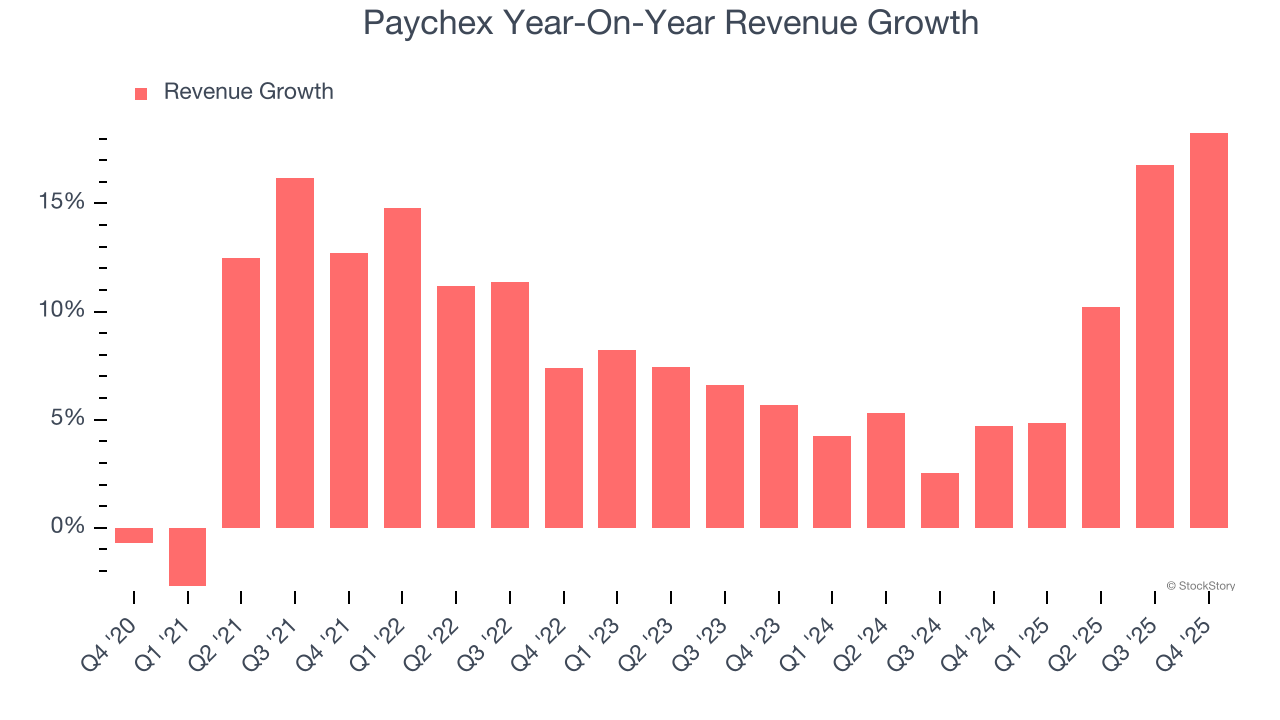
This quarter, Paychex’s year-on-year revenue growth was 18.3%, and its $1.56 billion of revenue was in line with Wall Street’s estimates.
Looking ahead, sell-side analysts expect revenue to grow 11.2% over the next 12 months. Although this projection suggests its newer products and services will spur better top-line performance, it is still below the sector average.
The 1999 book Gorilla Game predicted Microsoft and Apple would dominate tech before it happened. Its thesis? Identify the platform winners early. Today, enterprise software companies embedding generative AI are becoming the new gorillas. a profitable, fast-growing enterprise software stock that is already riding the automation wave and looking to catch the generative AI next.
Customer Acquisition Efficiency
The customer acquisition cost (CAC) payback period represents the months required to recover the cost of acquiring a new customer. Essentially, it’s the break-even point for sales and marketing investments. A shorter CAC payback period is ideal, as it implies better returns on investment and business scalability.
It’s relatively expensive for Paychex to acquire new customers as its CAC payback period checked in at 78.7 months this quarter. The company’s slow recovery of its sales and marketing expenses indicates it operates in a highly competitive market and must invest to stand out, even if the return on that investment is low. 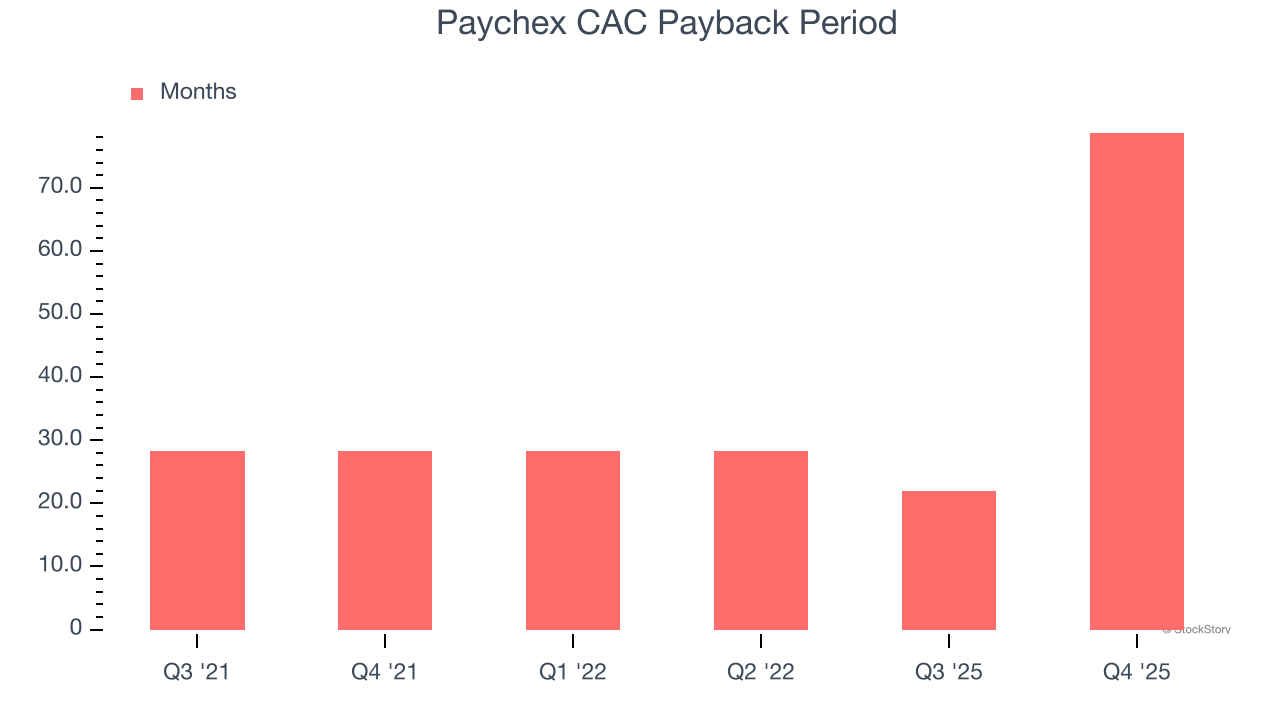
Key Takeaways from Paychex’s Q4 Results
Although revenue was in line, EPS managed to beat. Overall, this was a fine quarter. The stock traded up 3.1% to $117.76 immediately after reporting.
So do we think Paychex is an attractive buy at the current price? When making that decision, it’s important to consider its valuation, business qualities, as well as what has happened in the latest quarter. We cover that in our actionable full research report which you can read here, it’s free for active Edge members.


