Cloud content management platform Box (NYSE: BOX) beat Wall Street’s revenue expectations in Q3 CY2025, with sales up 9.1% year on year to $301.1 million. The company expects next quarter’s revenue to be around $304 million, close to analysts’ estimates. Its non-GAAP profit of $0.31 per share was in line with analysts’ consensus estimates.
Is now the time to buy Box? Find out by accessing our full research report, it’s free for active Edge members.
Box (BOX) Q3 CY2025 Highlights:
- Revenue: $301.1 million vs analyst estimates of $299 million (9.1% year-on-year growth, 0.7% beat)
- Adjusted EPS: $0.31 vs analyst estimates of $0.31 (in line)
- Adjusted Operating Income: $86.1 million vs analyst estimates of $83.82 million (28.6% margin, 2.7% beat)
- Revenue Guidance for Q4 CY2025 is $304 million at the midpoint, roughly in line with what analysts were expecting
- Management slightly raised its full-year Adjusted EPS guidance to $1.28 at the midpoint
- Operating Margin: 8.3%, in line with the same quarter last year
- Free Cash Flow Margin: 20.4%, up from 12.1% in the previous quarter
- Billings: $296 million at quarter end, up 11.8% year on year
- Market Capitalization: $4.25 billion
Company Overview
Known as the "Content Cloud" for managing the 90% of business data that exists as unstructured files and documents, Box (NYSE: BOX) provides a cloud-based platform that enables organizations to securely manage, share, and collaborate on their content from anywhere on any device.
Revenue Growth
Examining a company’s long-term performance can provide clues about its quality. Any business can have short-term success, but a top-tier one grows for years. Over the last five years, Box grew its sales at a sluggish 8.8% compounded annual growth rate. This was below our standard for the software sector and is a tough starting point for our analysis.
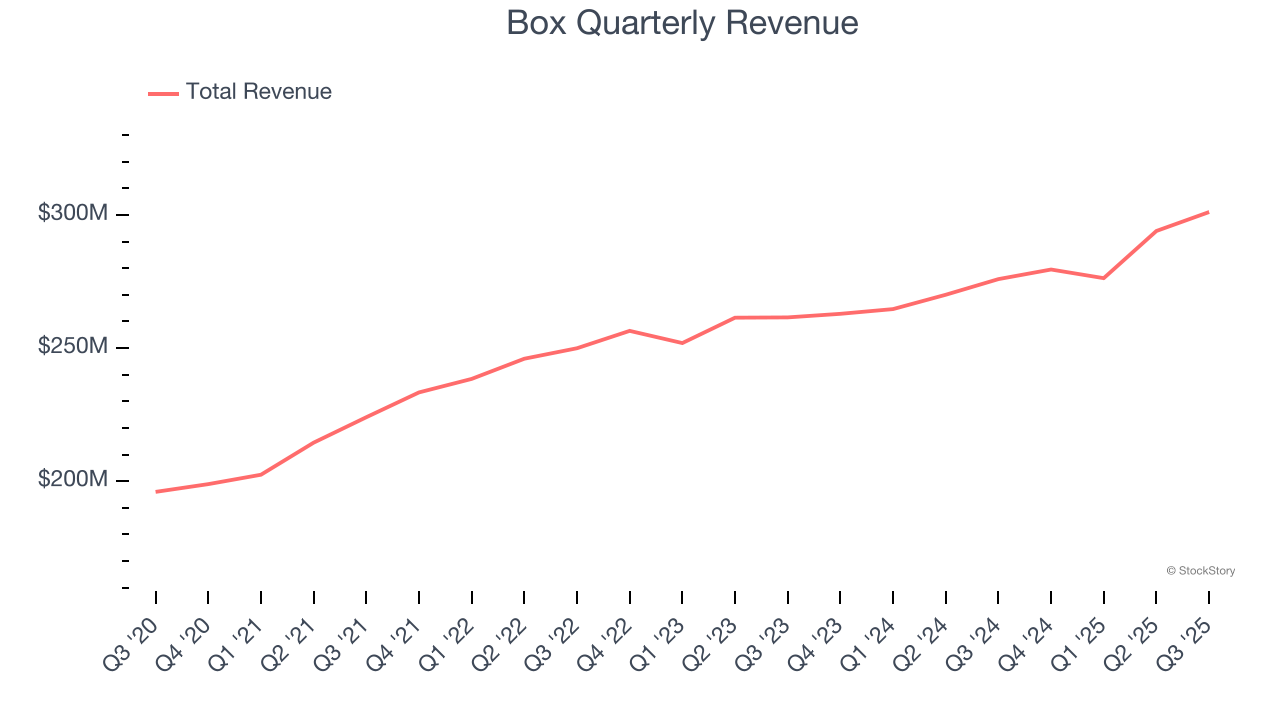
We at StockStory place the most emphasis on long-term growth, but within software, a half-decade historical view may miss recent innovations or disruptive industry trends. Box’s recent performance shows its demand has slowed as its annualized revenue growth of 5.6% over the last two years was below its five-year trend. 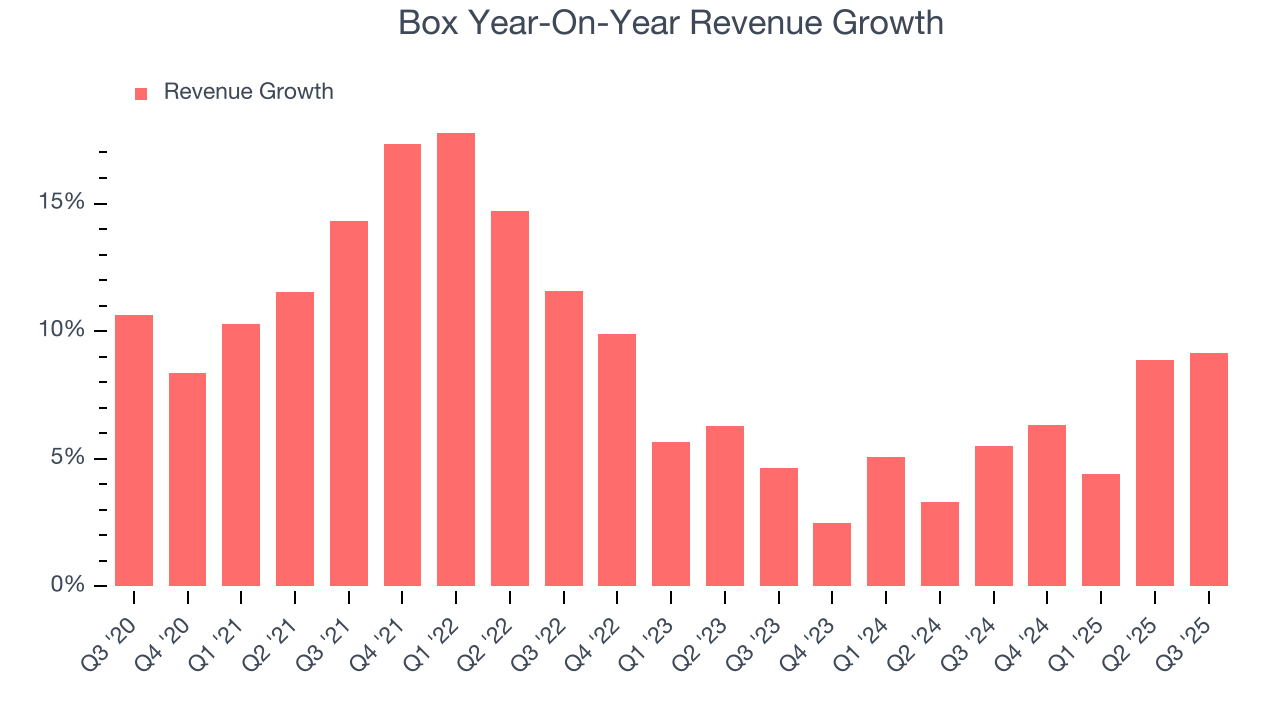
This quarter, Box reported year-on-year revenue growth of 9.1%, and its $301.1 million of revenue exceeded Wall Street’s estimates by 0.7%. Company management is currently guiding for a 8.8% year-on-year increase in sales next quarter.
Looking further ahead, sell-side analysts expect revenue to grow 7.3% over the next 12 months. Although this projection suggests its newer products and services will spur better top-line performance, it is still below the sector average.
Software is eating the world and there is virtually no industry left that has been untouched by it. That drives increasing demand for tools helping software developers do their jobs, whether it be monitoring critical cloud infrastructure, integrating audio and video functionality, or ensuring smooth content streaming. Click here to access a free report on our 3 favorite stocks to play this generational megatrend.
Billings
Billings is a non-GAAP metric that is often called “cash revenue” because it shows how much money the company has collected from customers in a certain period. This is different from revenue, which must be recognized in pieces over the length of a contract.
Box’s billings came in at $296 million in Q3, and over the last four quarters, its growth was underwhelming as it averaged 11.9% year-on-year increases. However, this alternate topline metric grew faster than total sales, meaning the company collects cash upfront and then recognizes the revenue over the length of its contracts - a boost for its liquidity and future revenue prospects. 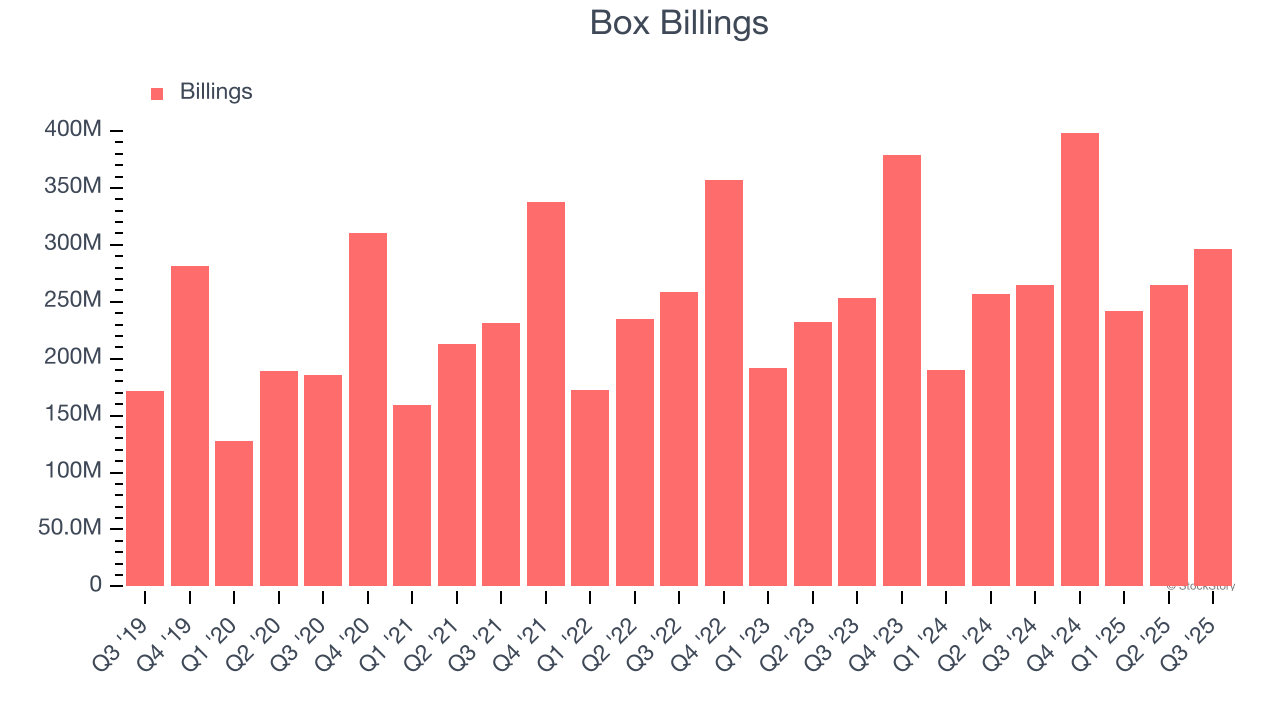
Customer Acquisition Efficiency
The customer acquisition cost (CAC) payback period measures the months a company needs to recoup the money spent on acquiring a new customer. This metric helps assess how quickly a business can break even on its sales and marketing investments.
Box is extremely efficient at acquiring new customers, and its CAC payback period checked in at 15.3 months this quarter. The company’s rapid recovery of its customer acquisition costs means it can attempt to spur growth by increasing its sales and marketing investments.
Key Takeaways from Box’s Q3 Results
It was encouraging to see Box beat analysts’ billings expectations this quarter. On the other hand, its EPS guidance for next quarter missed and its full-year EPS guidance fell short of Wall Street’s estimates. Overall, this was a softer quarter. The stock traded down 3.5% to $29.22 immediately following the results.
Box didn’t show it’s best hand this quarter, but does that create an opportunity to buy the stock right now? What happened in the latest quarter matters, but not as much as longer-term business quality and valuation, when deciding whether to invest in this stock. We cover that in our actionable full research report which you can read here, it’s free for active Edge members.


