CarGurus trades at $36 per share and has stayed right on track with the overall market, gaining 12.5% over the last six months. At the same time, the S&P 500 has returned 14.4%.
Is CARG a buy right now? Find out in our full research report, it’s free for active Edge members.
Why Does CARG Stock Spark Debate?
Bringing transparency to a sometimes opaque process, CarGurus (NASDAQ: CARG) is a digital marketplace where auto dealers can connect with potential customers and where car buyers can browse, purchase, and obtain financing.
Two Positive Attributes:
1. Eye-Popping Growth in Customer Spending
Average revenue per user (ARPU) is a critical metric to track because it measures how much the company earns in transaction fees from each user. ARPU also gives us unique insights into a user’s average order size and CarGurus’s take rate, or "cut", on each order.
CarGurus’s ARPU growth has been exceptional over the last two years, averaging 11.3%. Its ability to increase monetization while growing its paying dealers demonstrates its platform’s value, as its users are spending significantly more than last year. 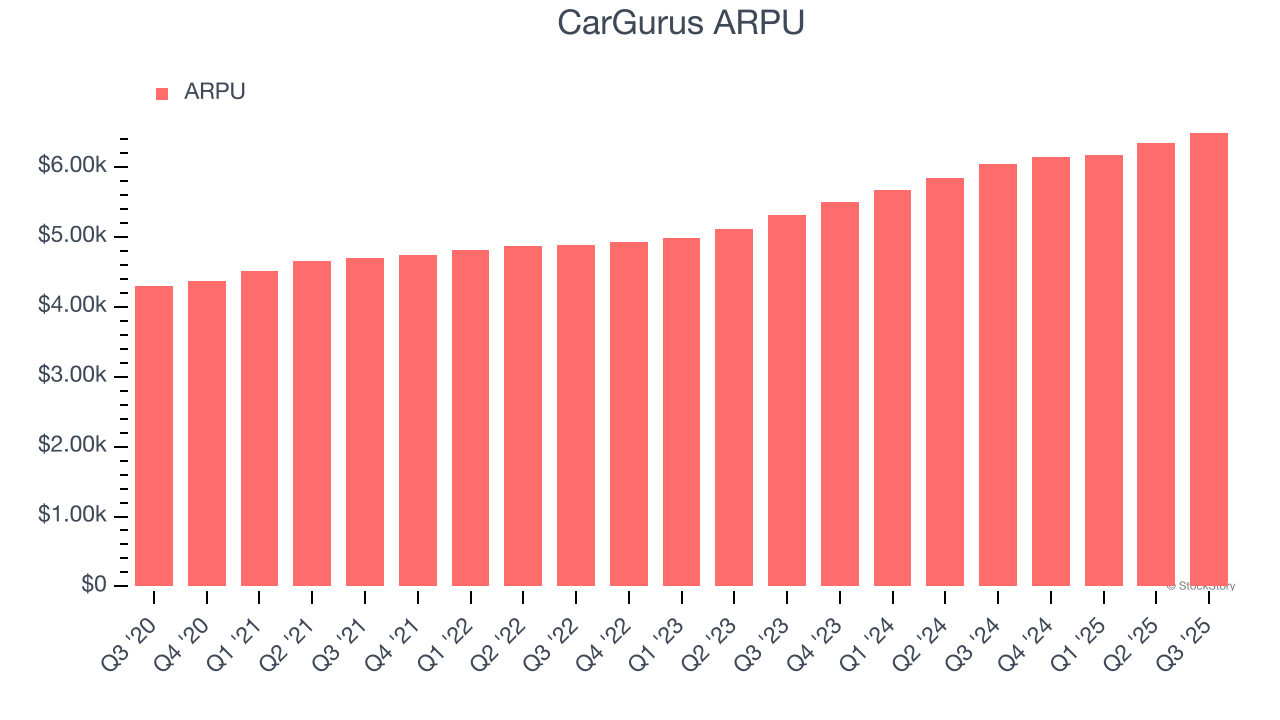
2. Increasing Free Cash Flow Margin Juices Financials
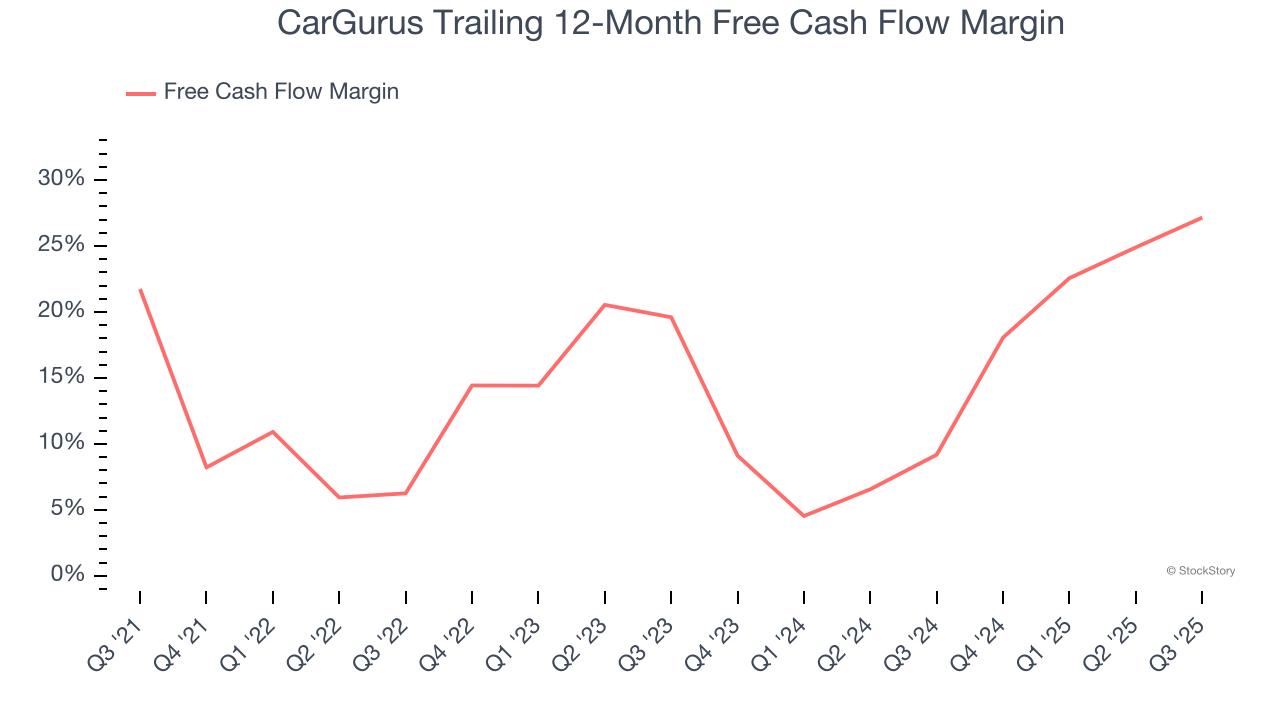
If you’ve followed StockStory for a while, you know we emphasize free cash flow. Why, you ask? We believe that in the end, cash is king, and you can’t use accounting profits to pay the bills.
As you can see below, CarGurus’s margin expanded by 20.9 percentage points over the last few years. This is encouraging, and we can see it became a less capital-intensive business because its free cash flow profitability rose more than its operating profitability. CarGurus’s free cash flow margin for the trailing 12 months was 27.2%.
One Reason to be Careful:
Change in Paying Dealers Points to Soft Demand
As an online marketplace, CarGurus generates revenue growth by increasing both the number of users on its platform and the average order size in dollars.
Over the last two years, CarGurus’s paying dealers, a key performance metric for the company, increased by 2.5% annually to 33,673 in the latest quarter. This growth rate is one of the lowest in the consumer internet sector. If CarGurus wants to accelerate growth, it likely needs to engage users more effectively with its existing offerings or innovate with new products. 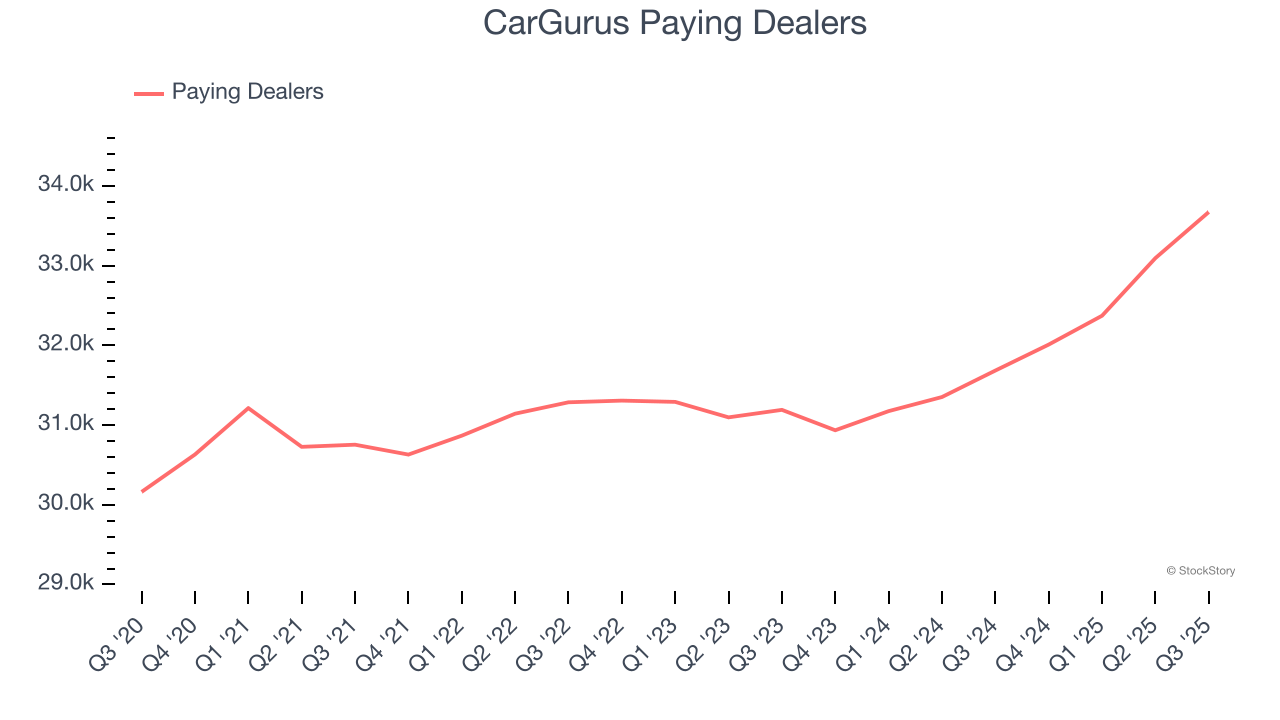
Final Judgment
CarGurus has huge potential even though it has some open questions, but at $36 per share (or 10.4× forward EV/EBITDA), is now the right time to buy the stock? See for yourself in our full research report, it’s free for active Edge members.
Stocks We Like Even More Than CarGurus
The market’s up big this year - but there’s a catch. Just 4 stocks account for half the S&P 500’s entire gain. That kind of concentration makes investors nervous, and for good reason. While everyone piles into the same crowded names, smart investors are hunting quality where no one’s looking - and paying a fraction of the price. Check out the high-quality names we’ve flagged in our Top 9 Market-Beating Stocks. This is a curated list of our High Quality stocks that have generated a market-beating return of 244% over the last five years (as of June 30, 2025).
Stocks that have made our list include now familiar names such as Nvidia (+1,326% between June 2020 and June 2025) as well as under-the-radar businesses like the once-micro-cap company Tecnoglass (+1,754% five-year return). Find your next big winner with StockStory today.
StockStory is growing and hiring equity analyst and marketing roles. Are you a 0 to 1 builder passionate about the markets and AI? See the open roles here.