
IoT solutions provider Samsara (NYSE: IOT) reported Q3 CY2025 results beating Wall Street’s revenue expectations, with sales up 29.2% year on year to $416 million. Guidance for next quarter’s revenue was better than expected at $422 million at the midpoint, 0.7% above analysts’ estimates. Its non-GAAP profit of $0.15 per share was 26.4% above analysts’ consensus estimates.
Is now the time to buy Samsara? Find out by accessing our full research report, it’s free for active Edge members.
Samsara (IOT) Q3 CY2025 Highlights:
- Revenue: $416 million vs analyst estimates of $399.4 million (29.2% year-on-year growth, 4.1% beat)
- Adjusted EPS: $0.15 vs analyst estimates of $0.12 (26.4% beat)
- Adjusted Operating Income: $79.79 million vs analyst estimates of $59.41 million (19.2% margin, 34.3% beat)
- Revenue Guidance for Q4 CY2025 is $422 million at the midpoint, roughly in line with what analysts were expecting
- Management raised its full-year Adjusted EPS guidance to $0.51 at the midpoint, a 9.8% increase
- Operating Margin: -0.4%, up from -14.7% in the same quarter last year
- Free Cash Flow Margin: 13.4%, up from 11.3% in the previous quarter
- Customers: 2,990 customers paying more than $100,000 annually
- Annual Recurring Revenue: $1.75 billion vs analyst estimates of $1.73 billion (29.4% year-on-year growth, 1.1% beat)
- Billings: $416 million at quarter end, up 22.7% year on year
- Market Capitalization: $22.38 billion
Company Overview
From sensors on vehicles to AI-powered cameras that help prevent accidents, Samsara (NYSE: IOT) is a cloud-based Internet of Things platform that helps businesses improve the safety, efficiency, and sustainability of their physical operations.
Revenue Growth
A company’s long-term sales performance can indicate its overall quality. Any business can experience short-term success, but top-performing ones enjoy sustained growth for years. Over the last five years, Samsara grew its sales at an incredible 47.8% compounded annual growth rate. Its growth surpassed the average software company and shows its offerings resonate with customers, a great starting point for our analysis.
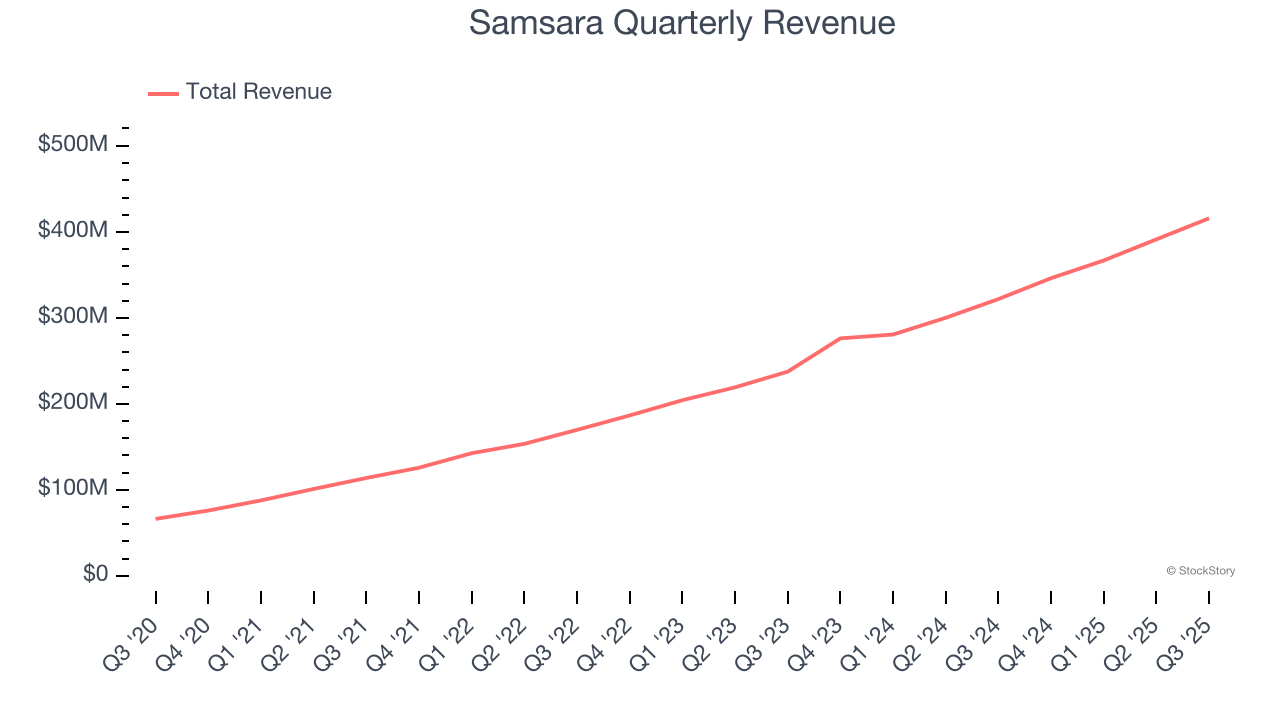
We at StockStory place the most emphasis on long-term growth, but within software, a half-decade historical view may miss recent innovations or disruptive industry trends. Samsara’s annualized revenue growth of 33.9% over the last two years is below its five-year trend, but we still think the results suggest healthy demand. 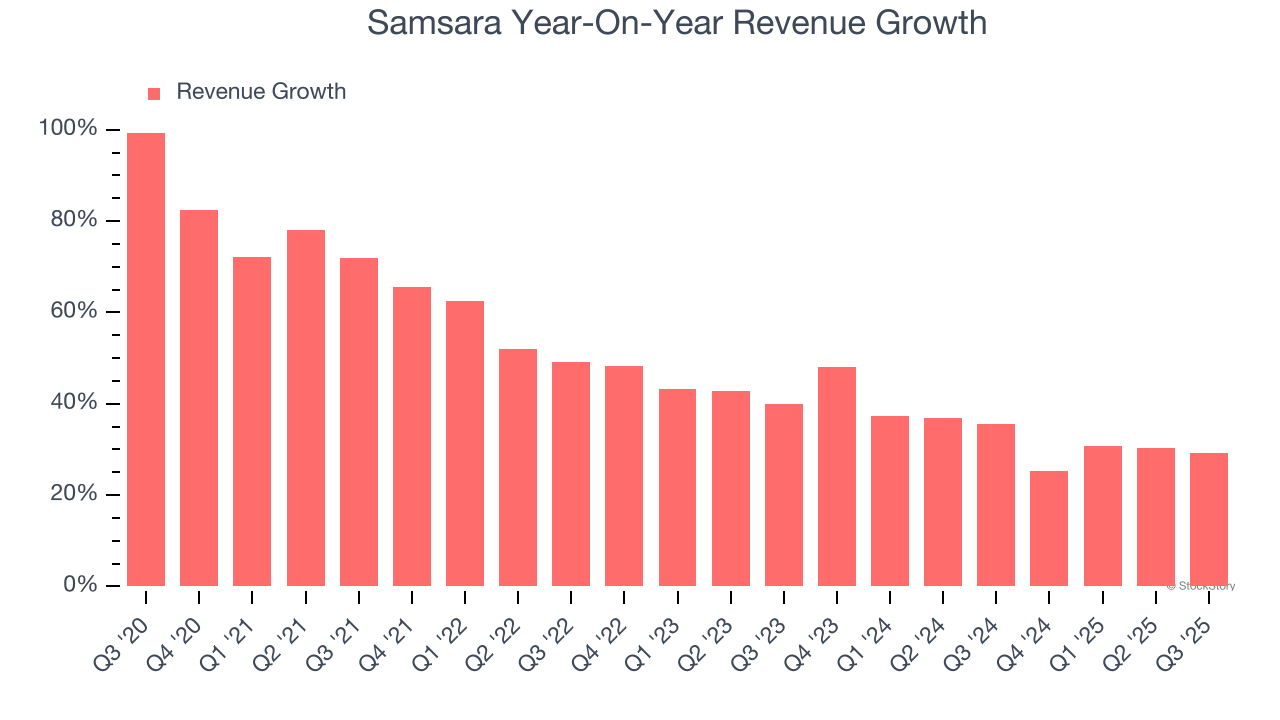
This quarter, Samsara reported robust year-on-year revenue growth of 29.2%, and its $416 million of revenue topped Wall Street estimates by 4.1%. Company management is currently guiding for a 21.9% year-on-year increase in sales next quarter.
Looking further ahead, sell-side analysts expect revenue to grow 19.3% over the next 12 months, a deceleration versus the last two years. Despite the slowdown, this projection is noteworthy and implies the market sees success for its products and services.
Microsoft, Alphabet, Coca-Cola, Monster Beverage—all began as under-the-radar growth stories riding a massive trend. We’ve identified the next one: a profitable AI semiconductor play Wall Street is still overlooking. Go here for access to our full report.
Annual Recurring Revenue
While reported revenue for a software company can include low-margin items like implementation fees, annual recurring revenue (ARR) is a sum of the next 12 months of contracted revenue purely from software subscriptions, or the high-margin, predictable revenue streams that make SaaS businesses so valuable.
Samsara’s ARR punched in at $1.75 billion in Q3, and over the last four quarters, its growth was fantastic as it averaged 30.5% year-on-year increases. This performance aligned with its total sales growth and shows that customers are willing to take multi-year bets on the company’s technology. Its growth also makes Samsara a more predictable business, a tailwind for its valuation as investors typically prefer businesses with recurring revenue. 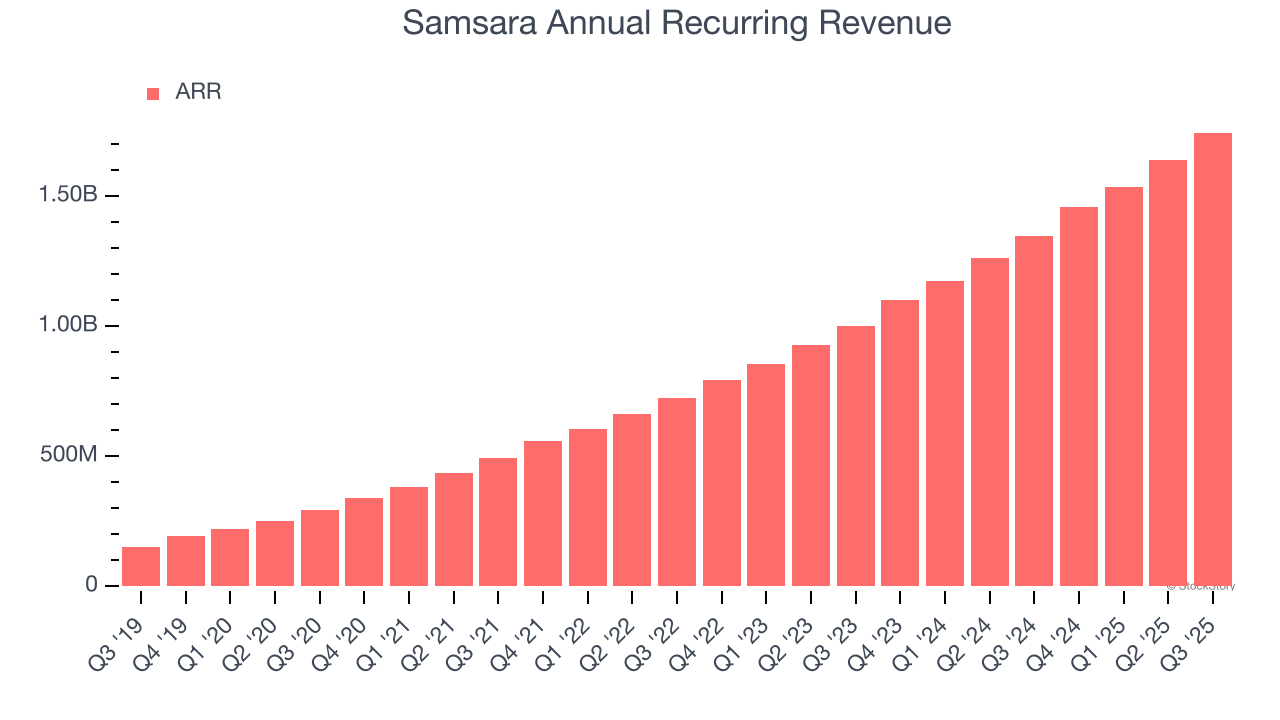
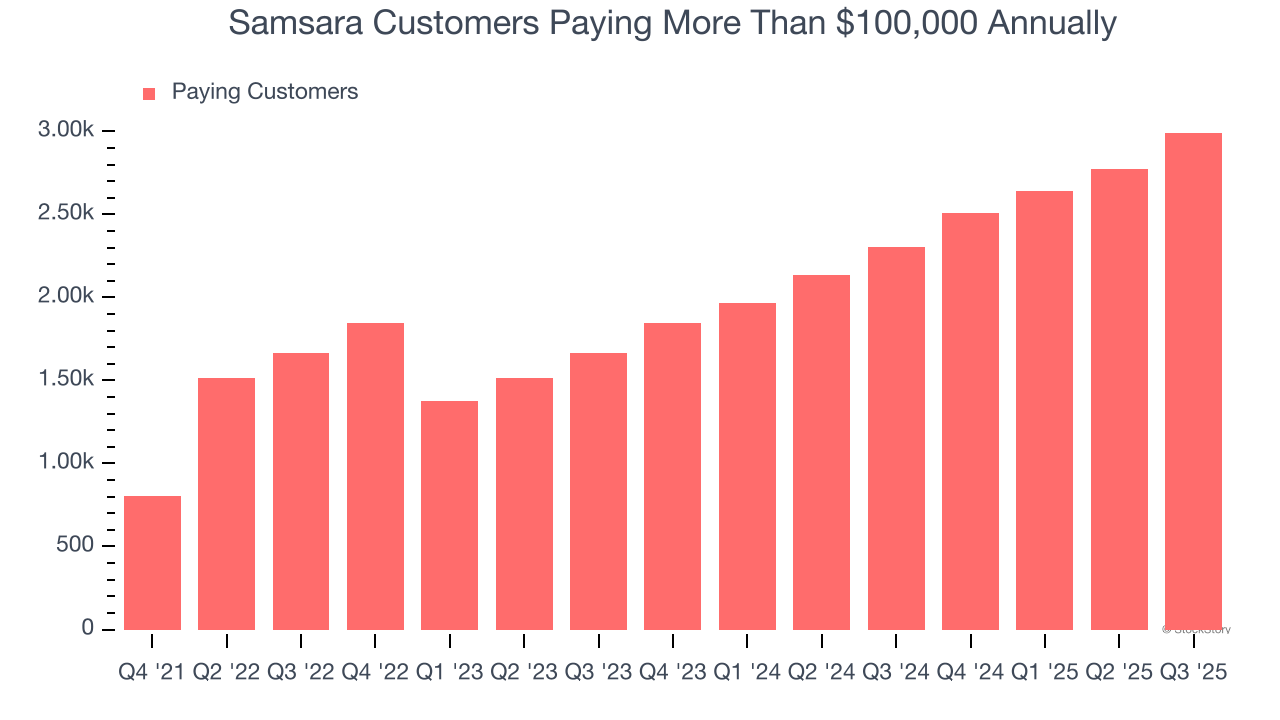
Enterprise Customer Base
This quarter, Samsara reported 2,990 enterprise customers paying more than $100,000 annually, an increase of 219 from the previous quarter. That’s quite a bit more contract wins than last quarter and quite a bit above what we’ve observed over the previous year. Shareholders should take this as an indication that Samsara’s go-to-market strategy is working well.
Key Takeaways from Samsara’s Q3 Results
We were impressed by how significantly Samsara blew past analysts’ EBITDA expectations this quarter. We were also glad its full-year EPS guidance trumped Wall Street’s estimates. On the other hand, its billings slightly missed. Overall, we think this was a decent quarter with some key metrics above expectations. Investors were likely hoping for more, and shares traded down 2.3% to $39.95 immediately following the results.
So do we think Samsara is an attractive buy at the current price? If you’re making that decision, you should consider the bigger picture of valuation, business qualities, as well as the latest earnings. We cover that in our actionable full research report which you can read here, it’s free for active Edge members.


