
AZZ has followed the market’s trajectory closely, rising in tandem with the S&P 500 over the past six months. The stock has climbed by 14% to $106.77 per share while the index has gained 15.3%.
Is AZZ a buy right now? Find out in our full research report, it’s free for active Edge members.
Why Does AZZ Spark Debate?
Responsible for projects like nuclear facilities, AZZ (NYSE: AZZ) is a provider of metal coating and power infrastructure solutions.
Two Positive Attributes:
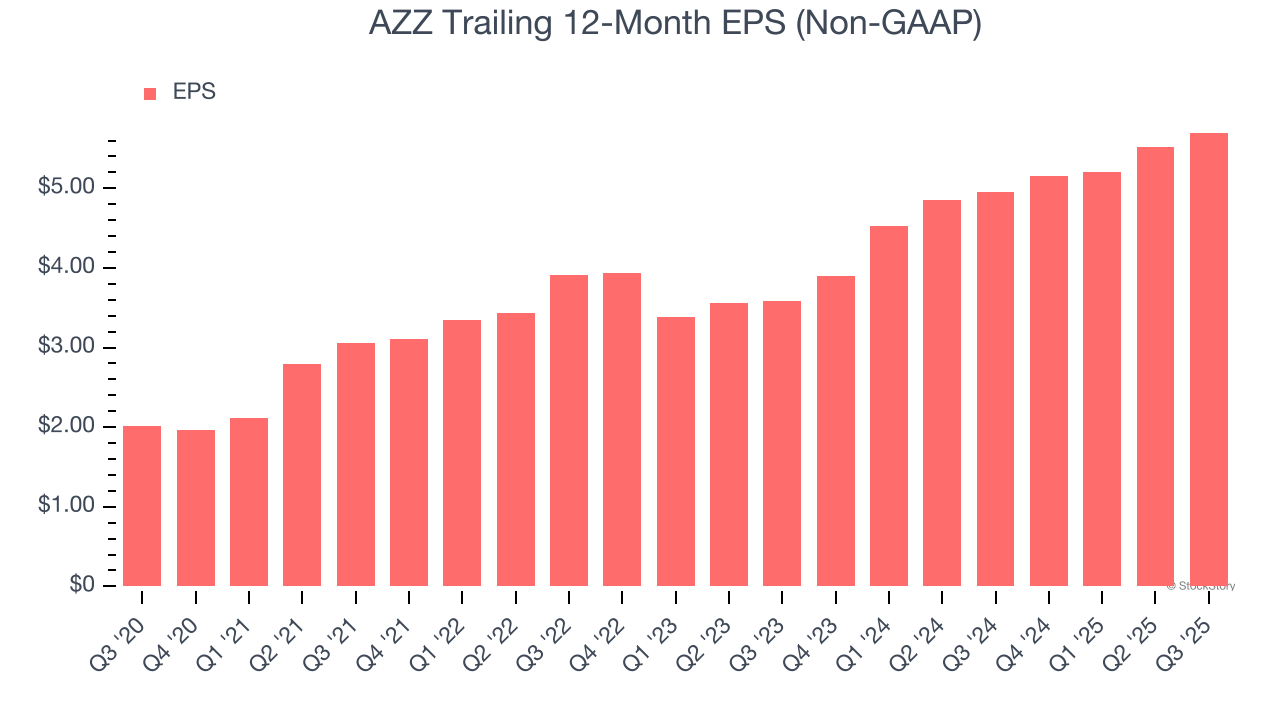
1. Outstanding Long-Term EPS Growth
We track the long-term change in earnings per share (EPS) because it highlights whether a company’s growth is profitable.
AZZ’s EPS grew at an astounding 23.2% compounded annual growth rate over the last five years, higher than its 10.8% annualized revenue growth. This tells us the company became more profitable on a per-share basis as it expanded.
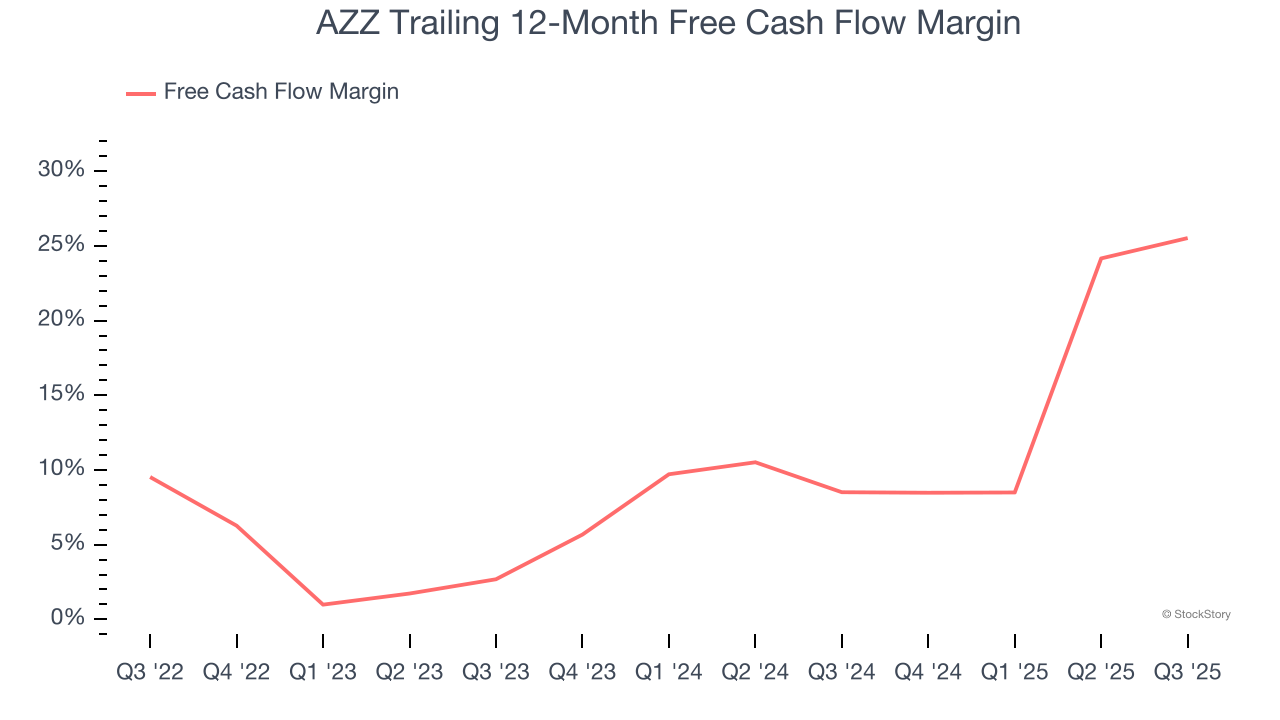
2. Increasing Free Cash Flow Margin Juices Financials
If you’ve followed StockStory for a while, you know we emphasize free cash flow. Why, you ask? We believe that in the end, cash is king, and you can’t use accounting profits to pay the bills.
As you can see below, AZZ’s margin expanded by 23 percentage points over the last five years. This is encouraging, and we can see it became a less capital-intensive business because its free cash flow profitability rose more than its operating profitability. AZZ’s free cash flow margin for the trailing 12 months was 25.5%.
One Reason to be Careful:
Lackluster Revenue Growth
Long-term growth is the most important, but within industrials, a stretched historical view may miss new industry trends or demand cycles. AZZ’s recent performance shows its demand has slowed significantly as its annualized revenue growth of 3.1% over the last two years was well below its five-year trend. 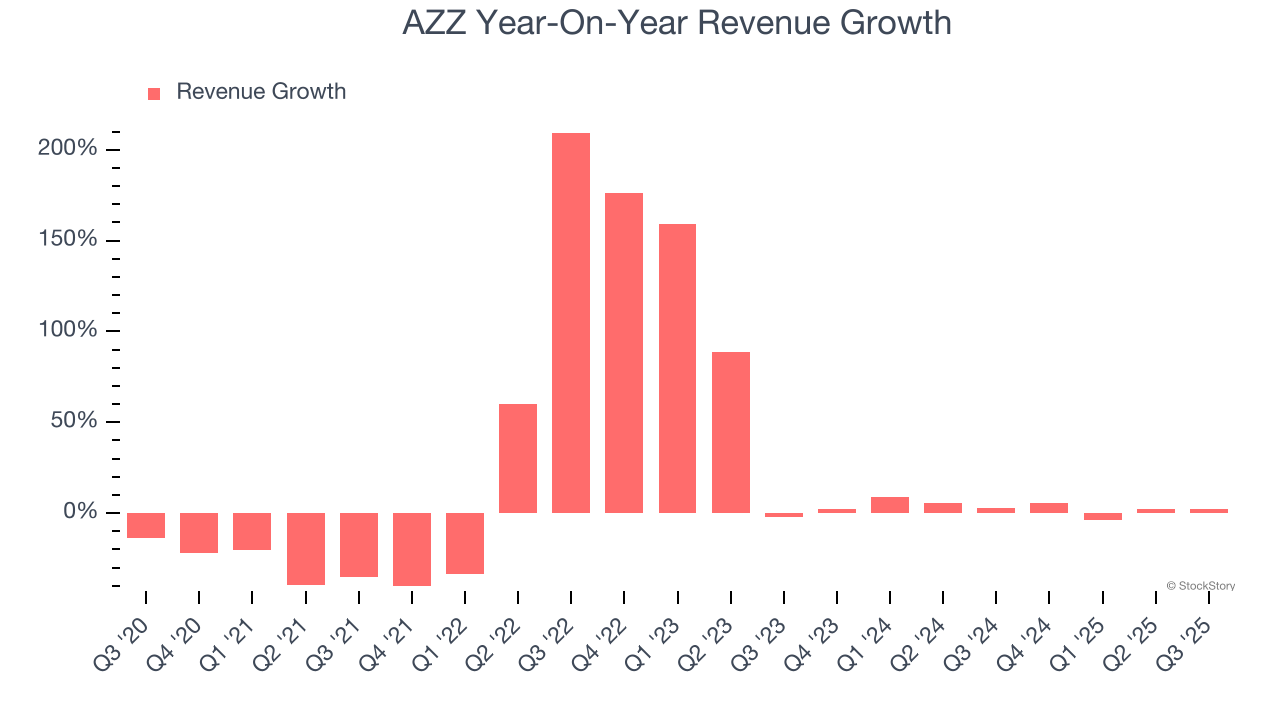
Final Judgment
AZZ has huge potential even though it has some open questions, but at $106.77 per share (or 17.2× forward P/E), is now the right time to buy the stock? See for yourself in our in-depth research report, it’s free for active Edge members.
Stocks We Like Even More Than AZZ
If your portfolio success hinges on just 4 stocks, your wealth is built on fragile ground. You have a small window to secure high-quality assets before the market widens and these prices disappear.
Don’t wait for the next volatility shock. Check out our Top 6 Stocks for this week. This is a curated list of our High Quality stocks that have generated a market-beating return of 244% over the last five years (as of June 30, 2025).
Stocks that have made our list include now familiar names such as Nvidia (+1,326% between June 2020 and June 2025) as well as under-the-radar businesses like the once-small-cap company Exlservice (+354% five-year return). Find your next big winner with StockStory today.
StockStory is growing and hiring equity analyst and marketing roles. Are you a 0 to 1 builder passionate about the markets and AI? See the open roles here.


