
Alignment Healthcare has had an impressive run over the past six months as its shares have beaten the S&P 500 by 15.5%. The stock now trades at $19.36, marking a 30.9% gain. This was partly thanks to its solid quarterly results, and the run-up might have investors contemplating their next move.
Is now still a good time to buy ALHC? Or is this a case of a company fueled by heightened investor enthusiasm? Find out in our full research report, it’s free for active Edge members.
Why Are We Positive On ALHC?
Founded in 2013 with a mission to transform healthcare for seniors, Alignment Healthcare (NASDAQ: ALHC) provides Medicare Advantage health plans for seniors with features like concierge services, transportation benefits, and technology-driven care coordination.
1. Customer Base Skyrockets, Fueling Growth Opportunities
Revenue growth can be broken down into the number of customers and the average spend per customer. Both are important because an increasing customer base leads to more upselling opportunities while the revenue per customer shows how successful a company was in executing its upselling strategy.
Alignment Healthcare’s total customers punched in at 229,600 in the latest quarter, and over the last two years, their count averaged 41.2% year-on-year growth. This performance was fantastic, reflecting its ability to "land" new contracts and potentially "expand" them later - a powerful one-two punch for sales. 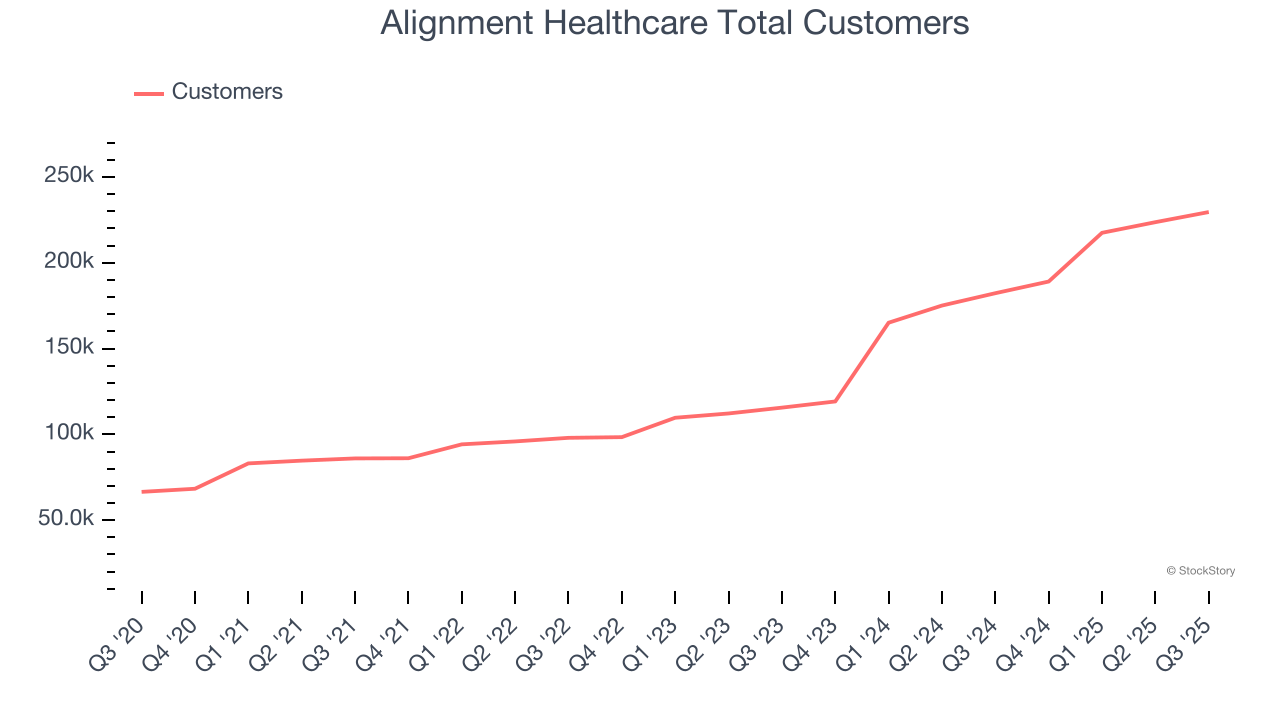
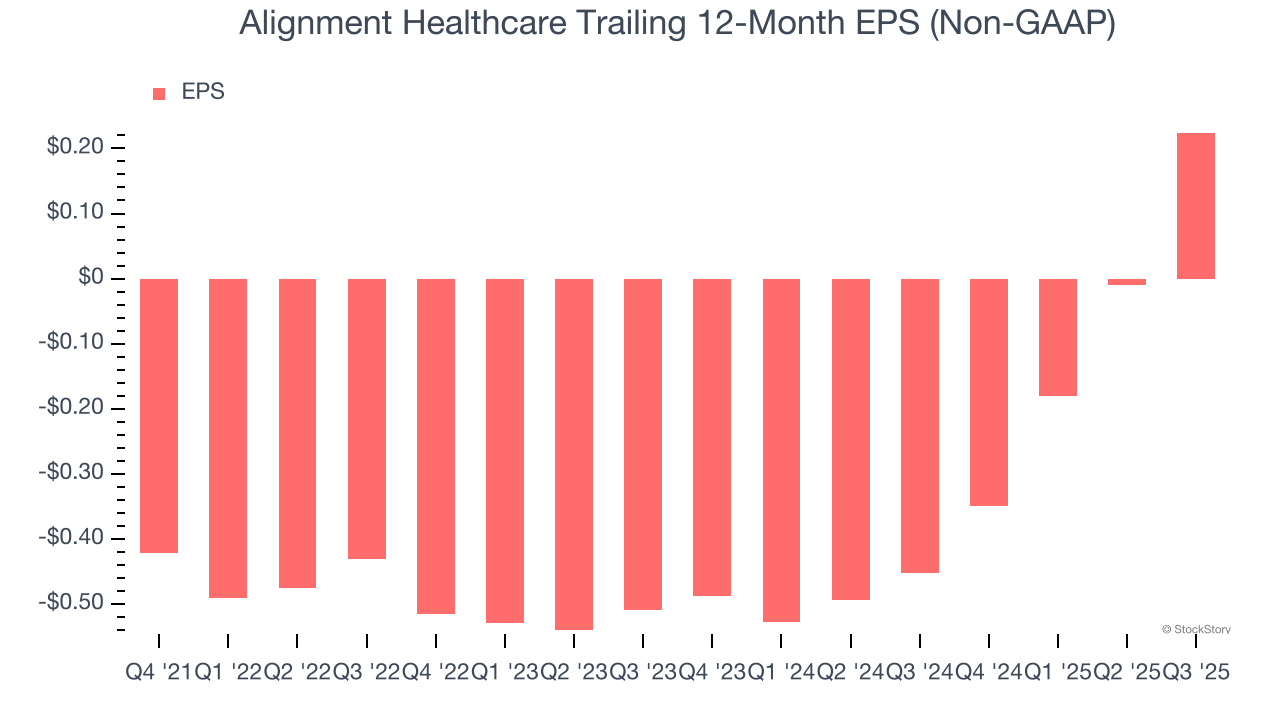
2. Outstanding Long-Term EPS Growth
We track the long-term change in earnings per share (EPS) because it highlights whether a company’s growth is profitable.
Alignment Healthcare’s full-year EPS flipped from negative to positive over the last four years. This is a good sign and shows it’s at an inflection point.
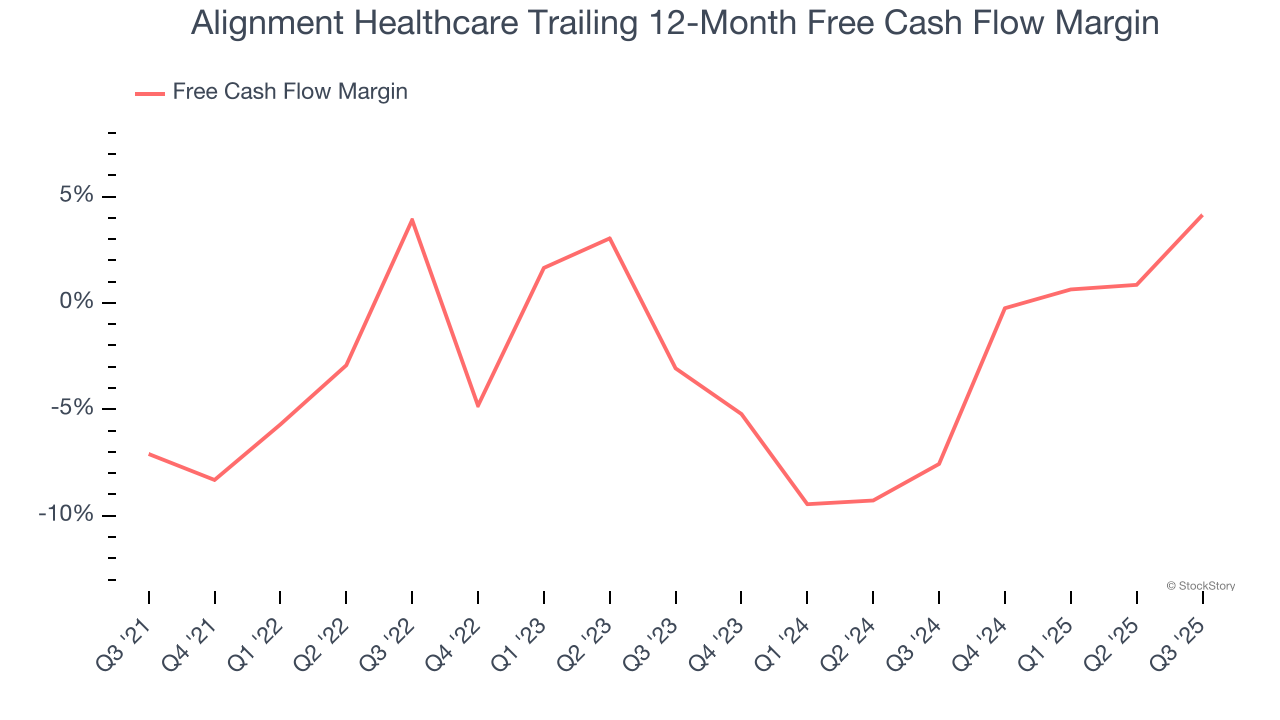
3. Increasing Free Cash Flow Margin Juices Financials
If you’ve followed StockStory for a while, you know we emphasize free cash flow. Why, you ask? We believe that in the end, cash is king, and you can’t use accounting profits to pay the bills.
As you can see below, Alignment Healthcare’s margin expanded by 11.2 percentage points over the last five years. Alignment Healthcare’s free cash flow margin for the trailing 12 months was 4.1%.
Final Judgment
These are just a few reasons why Alignment Healthcare ranks highly on our list, and with its shares topping the market in recent months, the stock trades at 95.5× forward P/E (or $19.36 per share). Is now a good time to buy? See for yourself in our comprehensive research report, it’s free for active Edge members .
Stocks We Like Even More Than Alignment Healthcare
Your portfolio can’t afford to be based on yesterday’s story. The risk in a handful of heavily crowded stocks is rising daily.
The names generating the next wave of massive growth are right here in our Top 5 Growth Stocks for this month. This is a curated list of our High Quality stocks that have generated a market-beating return of 244% over the last five years (as of June 30, 2025).
Stocks that have made our list include now familiar names such as Nvidia (+1,326% between June 2020 and June 2025) as well as under-the-radar businesses like the once-micro-cap company Kadant (+351% five-year return). Find your next big winner with StockStory today.
StockStory is growing and hiring equity analyst and marketing roles. Are you a 0 to 1 builder passionate about the markets and AI? See the open roles here.


