
Douglas Dynamics trades at $32.17 per share and has stayed right on track with the overall market, gaining 16.9% over the last six months. At the same time, the S&P 500 has returned 15.3%.
Is there a buying opportunity in Douglas Dynamics, or does it present a risk to your portfolio? Get the full stock story straight from our expert analysts, it’s free for active Edge members.
Why Is Douglas Dynamics Not Exciting?
We're swiping left on Douglas Dynamics for now. Here are three reasons we avoid PLOW and a stock we'd rather own.
1. Long-Term Revenue Growth Disappoints
A company’s long-term performance is an indicator of its overall quality. Any business can experience short-term success, but top-performing ones enjoy sustained growth for years. Regrettably, Douglas Dynamics’s sales grew at a tepid 5% compounded annual growth rate over the last five years. This fell short of our benchmark for the industrials sector.

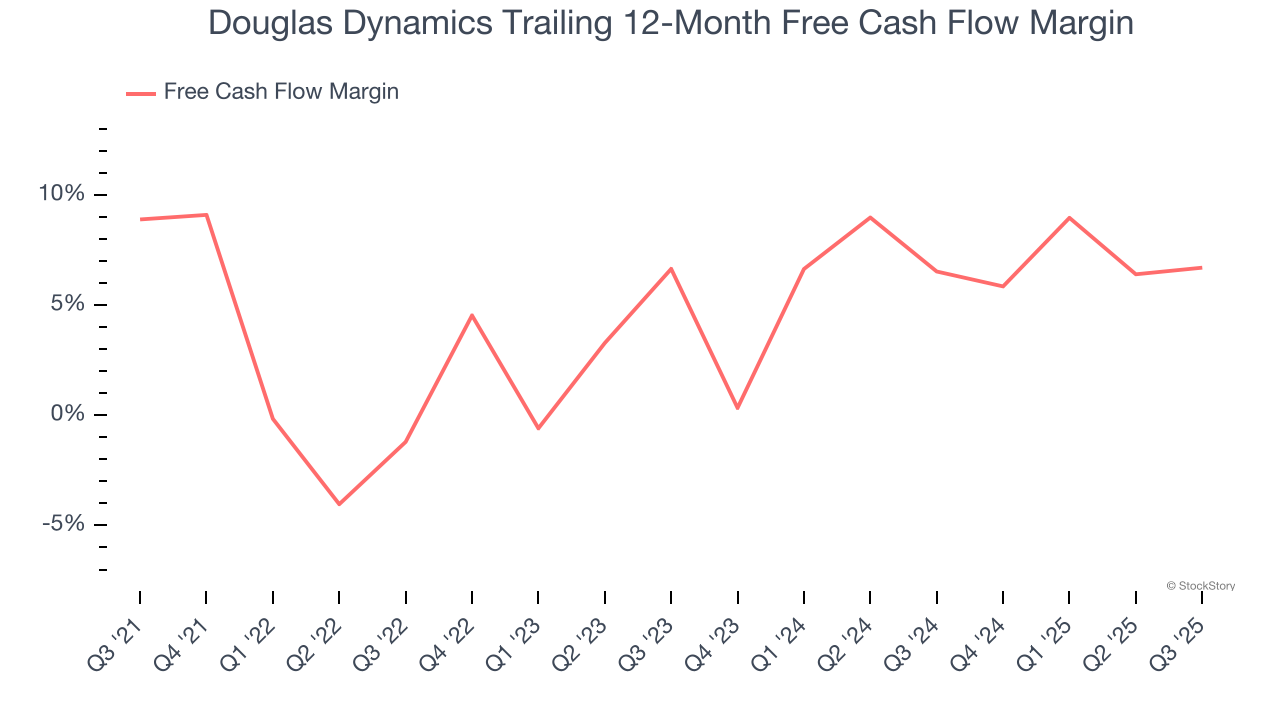
2. Free Cash Flow Margin Dropping
If you’ve followed StockStory for a while, you know we emphasize free cash flow. Why, you ask? We believe that in the end, cash is king, and you can’t use accounting profits to pay the bills.
As you can see below, Douglas Dynamics’s margin dropped by 2.2 percentage points over the last five years. This along with its unexciting margin put the company in a tough spot, and shareholders are likely hoping it can reverse course. If the trend continues, it could signal it’s in the middle of an investment cycle. Douglas Dynamics’s free cash flow margin for the trailing 12 months was 6.7%.
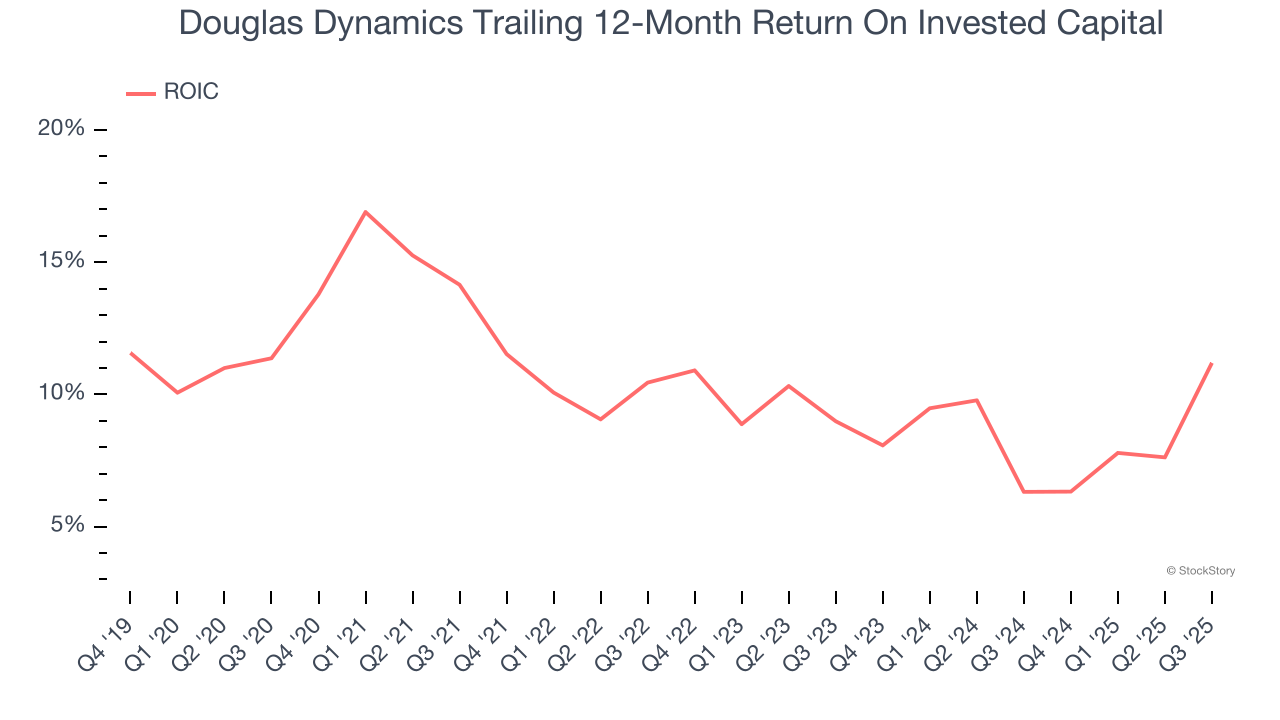
3. New Investments Fail to Bear Fruit as ROIC Declines
ROIC, or return on invested capital, is a metric showing how much operating profit a company generates relative to the money it has raised (debt and equity).
We like to invest in businesses with high returns, but the trend in a company’s ROIC is what often surprises the market and moves the stock price. Unfortunately, Douglas Dynamics’s ROIC averaged 3.5 percentage point decreases over the last few years. We like what management has done in the past, but its declining returns are perhaps a symptom of fewer profitable growth opportunities.
Final Judgment
Douglas Dynamics isn’t a terrible business, but it doesn’t pass our bar. That said, the stock currently trades at 13.6× forward P/E (or $32.17 per share). This valuation multiple is fair, but we don’t have much faith in the company. We're pretty confident there are more exciting stocks to buy at the moment. We’d suggest looking at the most entrenched endpoint security platform on the market.
Stocks We Like More Than Douglas Dynamics
Your portfolio can’t afford to be based on yesterday’s story. The risk in a handful of heavily crowded stocks is rising daily.
The names generating the next wave of massive growth are right here in our Top 6 Stocks for this week. This is a curated list of our High Quality stocks that have generated a market-beating return of 244% over the last five years (as of June 30, 2025).
Stocks that have made our list include now familiar names such as Nvidia (+1,326% between June 2020 and June 2025) as well as under-the-radar businesses like the once-small-cap company Exlservice (+354% five-year return). Find your next big winner with StockStory today.
StockStory is growing and hiring equity analyst and marketing roles. Are you a 0 to 1 builder passionate about the markets and AI? See the open roles here.


