Recreational products manufacturer American Outdoor Brands (NASDAQ: AOUT) reported Q3 CY2025 results topping the market’s revenue expectations, but sales fell by 5% year on year to $57.2 million. Its non-GAAP profit of $0.29 per share was 48.7% above analysts’ consensus estimates.
Is now the time to buy American Outdoor Brands? Find out by accessing our full research report, it’s free for active Edge members.
American Outdoor Brands (AOUT) Q3 CY2025 Highlights:
- Revenue: $57.2 million vs analyst estimates of $50.92 million (5% year-on-year decline, 12.3% beat)
- Adjusted EPS: $0.29 vs analyst estimates of $0.20 (48.7% beat)
- Adjusted EBITDA: $6.48 million vs analyst estimates of $4.01 million (11.3% margin, 61.5% beat)
- Operating Margin: 3.7%, down from 5.1% in the same quarter last year
- Free Cash Flow was -$14.37 million compared to -$8.00 million in the same quarter last year
- Market Capitalization: $91.13 million
Brian Murphy, President and CEO, said, "Our commitment to innovation, paired with disciplined execution of our long-term strategy to enter new outdoor categories, is fueling the strength of our growth brands and the engagement we are seeing from consumers and retail partners. Pull-through of our products at retail was notably strong during the quarter, with total POS up 4% year-over-year. Together, these factors enabled us to deliver second-quarter results that surpassed our expectations, even amid a dynamic retail backdrop.
Company Overview
Spun off from Smith and Wesson in 2020, American Outdoor Brands (NASDAQ: AOUT) is an outdoor and recreational products company that offers outdoor and shooting sports products but does not sell firearms themselves.
Revenue Growth
A company’s long-term performance is an indicator of its overall quality. Any business can have short-term success, but a top-tier one grows for years. Unfortunately, American Outdoor Brands struggled to consistently increase demand as its $207.3 million of sales for the trailing 12 months was close to its revenue five years ago. This was below our standards and is a sign of poor business quality.

Long-term growth is the most important, but within consumer discretionary, product cycles are short and revenue can be hit-driven due to rapidly changing trends and consumer preferences. American Outdoor Brands’s annualized revenue growth of 3.3% over the last two years is above its five-year trend, but we were still disappointed by the results. 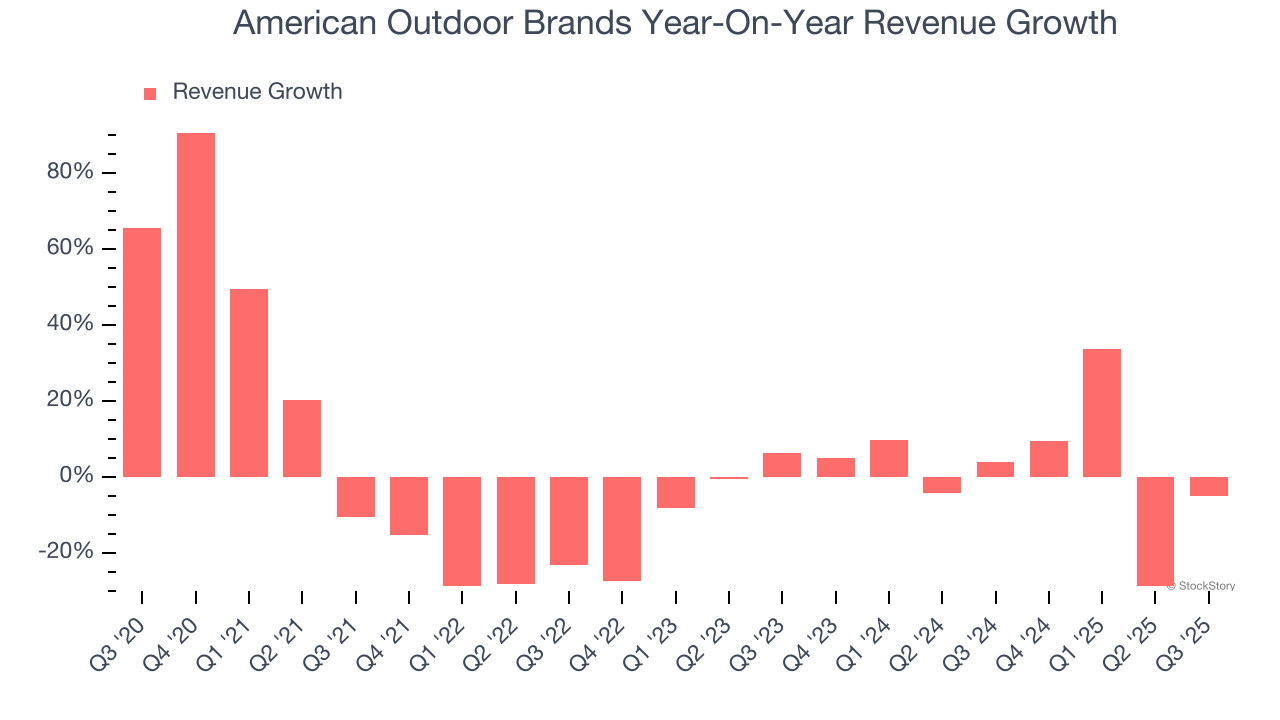
This quarter, American Outdoor Brands’s revenue fell by 5% year on year to $57.2 million but beat Wall Street’s estimates by 12.3%.
Looking ahead, sell-side analysts expect revenue to remain flat over the next 12 months, a deceleration versus the last two years. This projection is underwhelming and indicates its products and services will face some demand challenges.
While Wall Street chases Nvidia at all-time highs, an under-the-radar semiconductor supplier is dominating a critical AI component these giants can’t build without. Click here to access our free report one of our favorites growth stories.
Operating Margin
Operating margin is a key measure of profitability. Think of it as net income - the bottom line - excluding the impact of taxes and interest on debt, which are less connected to business fundamentals.
American Outdoor Brands’s operating margin has been trending up over the last 12 months, but it still averaged negative 3.2% over the last two years. This is due to its large expense base and inefficient cost structure.
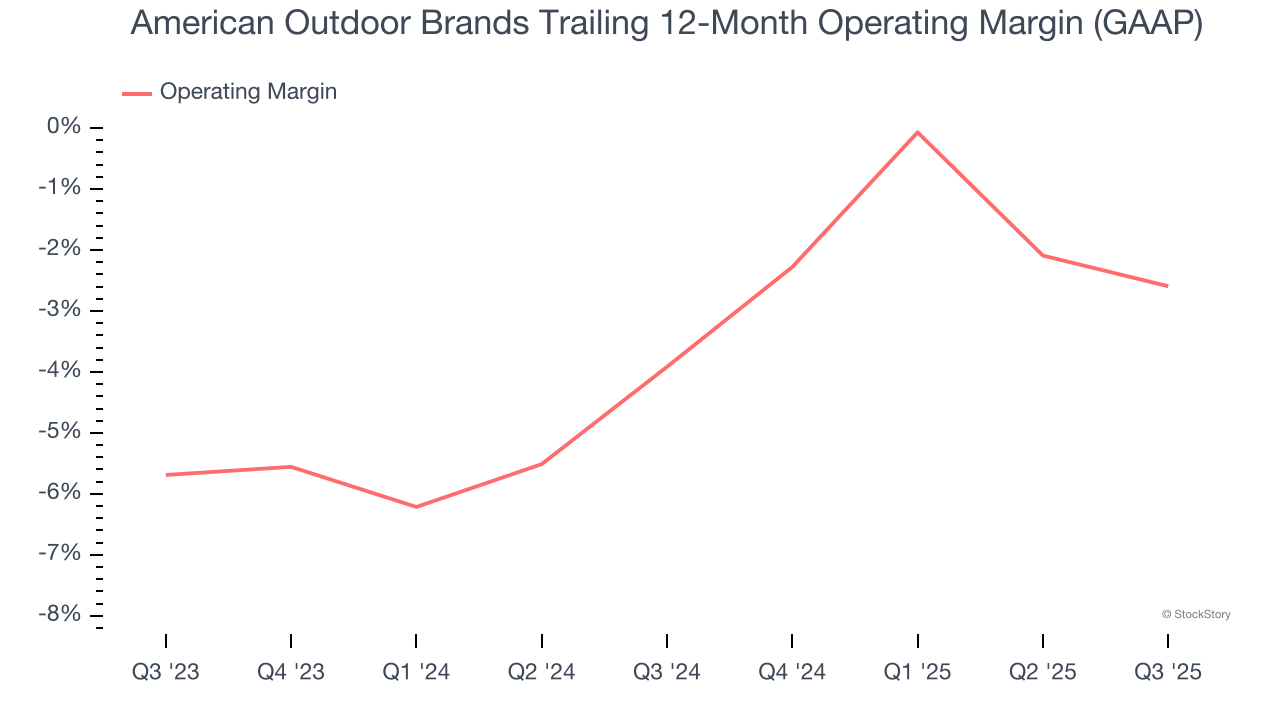
In Q3, American Outdoor Brands generated an operating margin profit margin of 3.7%, down 1.4 percentage points year on year. This reduction is quite minuscule and indicates the company’s overall cost structure has been relatively stable.
Earnings Per Share
We track the long-term change in earnings per share (EPS) for the same reason as long-term revenue growth. Compared to revenue, however, EPS highlights whether a company’s growth is profitable.
Sadly for American Outdoor Brands, its EPS declined by 51.6% annually over the last five years while its revenue was flat. This tells us the company struggled because its fixed cost base made it difficult to adjust to choppy demand.
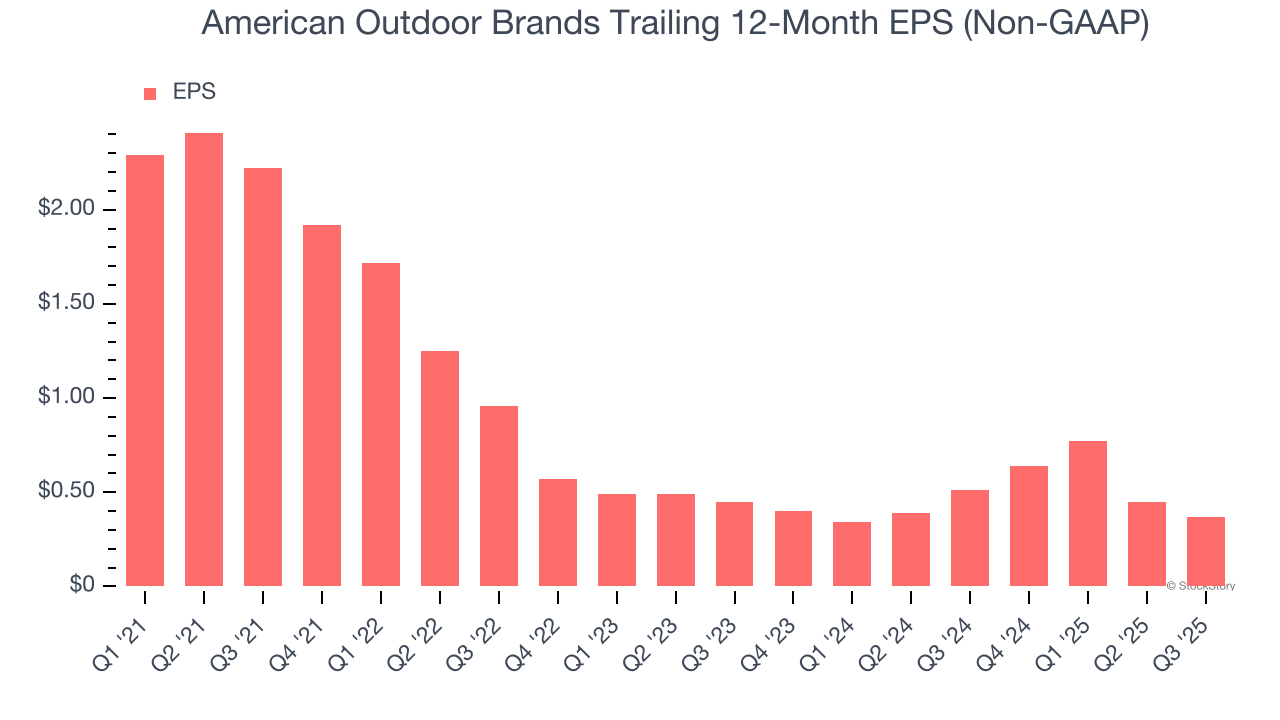
In Q3, American Outdoor Brands reported adjusted EPS of $0.29, down from $0.37 in the same quarter last year. Despite falling year on year, this print easily cleared analysts’ estimates. Over the next 12 months, Wall Street expects American Outdoor Brands’s full-year EPS of $0.37 to shrink by 32.4%.
Key Takeaways from American Outdoor Brands’s Q3 Results
It was good to see American Outdoor Brands beat analysts’ EPS expectations this quarter. We were also excited its EBITDA outperformed Wall Street’s estimates by a wide margin. Zooming out, we think this quarter featured some important positives. The stock traded up 3% to $7.98 immediately after reporting.
American Outdoor Brands put up rock-solid earnings, but one quarter doesn’t necessarily make the stock a buy. Let’s see if this is a good investment. If you’re making that decision, you should consider the bigger picture of valuation, business qualities, as well as the latest earnings. We cover that in our actionable full research report which you can read here, it’s free for active Edge members.