Chicken producer Pilgrim’s Pride (NASDAQ: PPC) fell short of the market’s revenue expectations in Q4 CY2024, with sales falling 3.5% year on year to $4.37 billion. Its non-GAAP profit of $1.35 per share was 16.9% above analysts’ consensus estimates.
Is now the time to buy Pilgrim's Pride? Find out by accessing our full research report, it’s free.
Pilgrim's Pride (PPC) Q4 CY2024 Highlights:
- Revenue: $4.37 billion vs analyst estimates of $4.66 billion (3.5% year-on-year decline, 6.1% miss)
- Adjusted EPS: $1.35 vs analyst estimates of $1.16 (16.9% beat)
- Adjusted EBITDA: $525.7 million vs analyst estimates of $509 million (12% margin, 3.3% beat)
- Operating Margin: 7%, up from 4.1% in the same quarter last year
- Free Cash Flow Margin: 4.3%, similar to the same quarter last year
- Market Capitalization: $12.46 billion
“While we experienced a positive market environment with lower input costs and strong chicken demand in 2024, we elevated our performance across all regions through a continued focus on controlling what we can control,” said Fabio Sandri, Pilgrim’s President and CEO.
Company Overview
Offering everything from pre-marinated to frozen chicken, Pilgrim’s Pride (NASDAQ: PPC) produces, processes, and distributes chicken products to retailers and food service customers.
Perishable Food
The perishable food industry is diverse, encompassing large-scale producers and distributors to specialty and artisanal brands. These companies sell produce, dairy products, meats, and baked goods and have become integral to serving modern American consumers who prioritize freshness, quality, and nutritional value. Investing in perishable food stocks presents both opportunities and challenges. While the perishable nature of products can introduce risks related to supply chain management and shelf life, it also creates a constant demand driven by the necessity for fresh food. Companies that can efficiently manage inventory, distribution, and quality control are well-positioned to thrive in this competitive market. Navigating the perishable food industry requires adherence to strict food safety standards, regulations, and labeling requirements.
Sales Growth
Examining a company’s long-term performance can provide clues about its quality. Any business can put up a good quarter or two, but the best consistently grow over the long haul.
With $17.88 billion in revenue over the past 12 months, Pilgrim's Pride is larger than most consumer staples companies and benefits from economies of scale, enabling it to gain more leverage on its fixed costs than smaller competitors. Its size also gives it negotiating leverage with distributors, allowing its products to reach more shelves. However, its scale is a double-edged sword because it's harder to find incremental growth when your existing brands have penetrated most of the market. To accelerate sales, Pilgrim's Pride must lean into newer products.
As you can see below, Pilgrim's Pride’s 6.6% annualized revenue growth over the last three years was mediocre. This shows it couldn’t generate demand in any major way and is a tough starting point for our analysis.
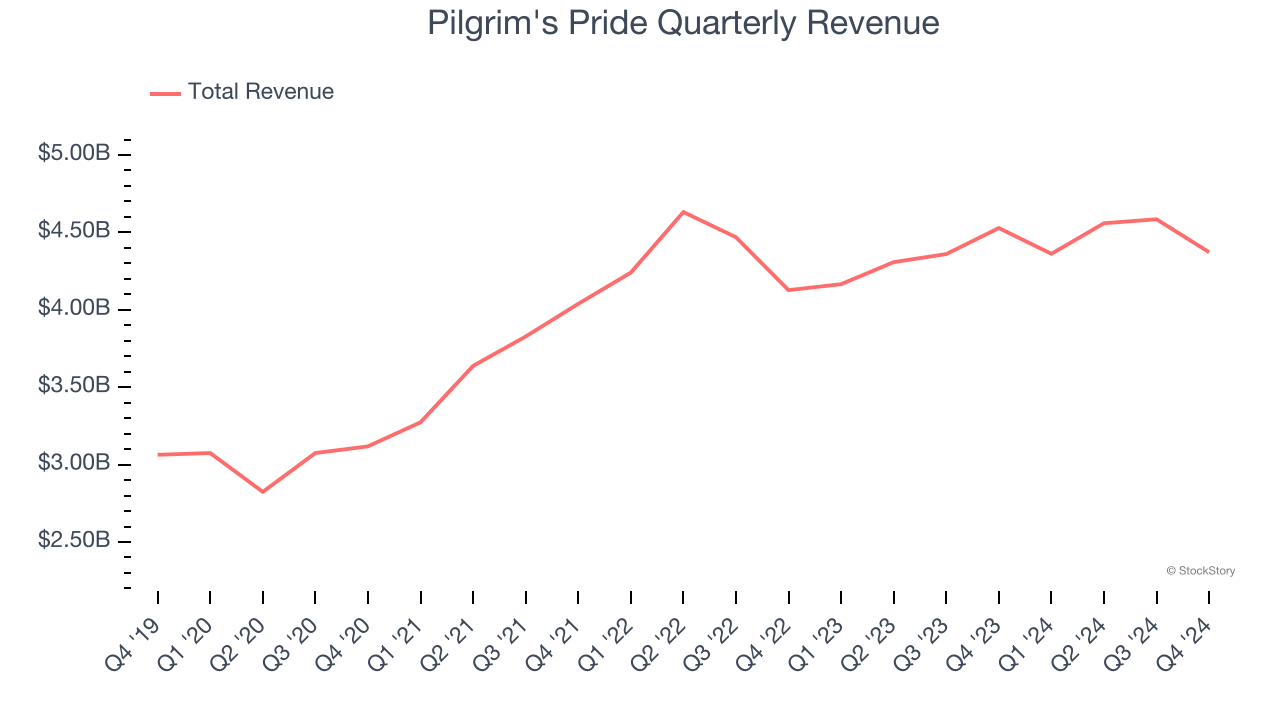
This quarter, Pilgrim's Pride missed Wall Street’s estimates and reported a rather uninspiring 3.5% year-on-year revenue decline, generating $4.37 billion of revenue.
Looking ahead, sell-side analysts expect revenue to grow 3.5% over the next 12 months, a deceleration versus the last three years. This projection is underwhelming and implies its products will see some demand headwinds.
Here at StockStory, we certainly understand the potential of thematic investing. Diverse winners from Microsoft (MSFT) to Alphabet (GOOG), Coca-Cola (KO) to Monster Beverage (MNST) could all have been identified as promising growth stories with a megatrend driving the growth. So, in that spirit, we’ve identified a relatively under-the-radar profitable growth stock benefiting from the rise of AI, available to you FREE via this link.
Cash Is King
If you’ve followed StockStory for a while, you know we emphasize free cash flow. Why, you ask? We believe that in the end, cash is king, and you can’t use accounting profits to pay the bills.
Pilgrim's Pride has shown mediocre cash profitability over the last two years, giving the company limited opportunities to return capital to shareholders. Its free cash flow margin averaged 4.7%, subpar for a consumer staples business.
Taking a step back, an encouraging sign is that Pilgrim's Pride’s margin expanded by 7.7 percentage points over the last year. The company’s improvement shows it’s heading in the right direction, and we can see it became a less capital-intensive business because its free cash flow profitability rose more than its operating profitability.
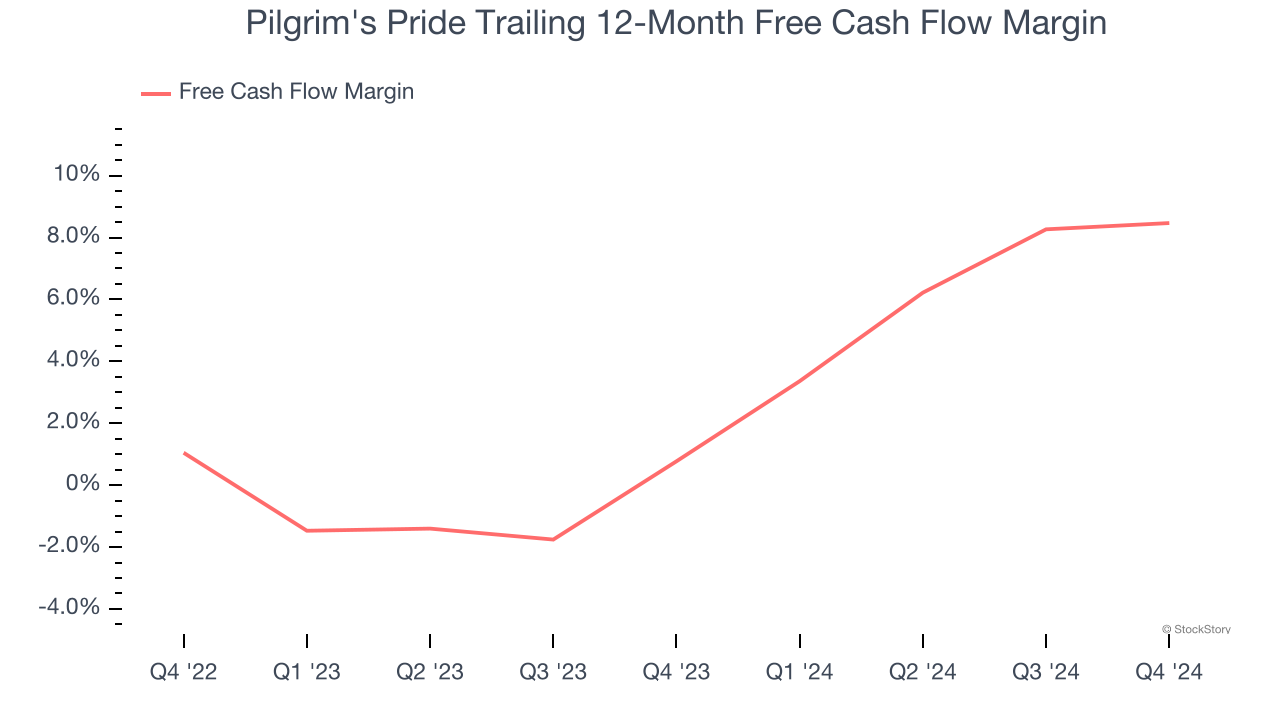
Pilgrim's Pride’s free cash flow clocked in at $190.1 million in Q4, equivalent to a 4.3% margin. This cash profitability was in line with the comparable period last year and its two-year average.
Key Takeaways from Pilgrim's Pride’s Q4 Results
We were impressed by how significantly Pilgrim's Pride beat analysts’ gross margin expectations this quarter. We were also happy its EBITDA outperformed Wall Street’s estimates. On the other hand, its revenue missed significantly. Zooming out, we think this was a mixed quarter. The stock remained flat at $50.18 immediately following the results.
So do we think Pilgrim's Pride is an attractive buy at the current price? If you’re making that decision, you should consider the bigger picture of valuation, business qualities, as well as the latest earnings. We cover that in our actionable full research report which you can read here, it’s free.