Columbus McKinnon has gotten torched over the last six months - since September 2024, its stock price has dropped 41.2% to $17.94 per share. This was partly driven by its softer quarterly results and might have investors contemplating their next move.
Is now the time to buy Columbus McKinnon, or should you be careful about including it in your portfolio? Get the full stock story straight from our expert analysts, it’s free.
Even though the stock has become cheaper, we're swiping left on Columbus McKinnon for now. Here are three reasons why you should be careful with CMCO and a stock we'd rather own.
Why Do We Think Columbus McKinnon Will Underperform?
With 19 different brands across the globe, Columbus McKinnon (NASDAQ: CMCO) offers material handling equipment for the construction, manufacturing, and transportation industries.
1. Long-Term Revenue Growth Disappoints
A company’s long-term sales performance can indicate its overall quality. Any business can put up a good quarter or two, but the best consistently grow over the long haul. Over the last five years, Columbus McKinnon grew its sales at a sluggish 3.3% compounded annual growth rate. This fell short of our benchmark for the industrials sector. 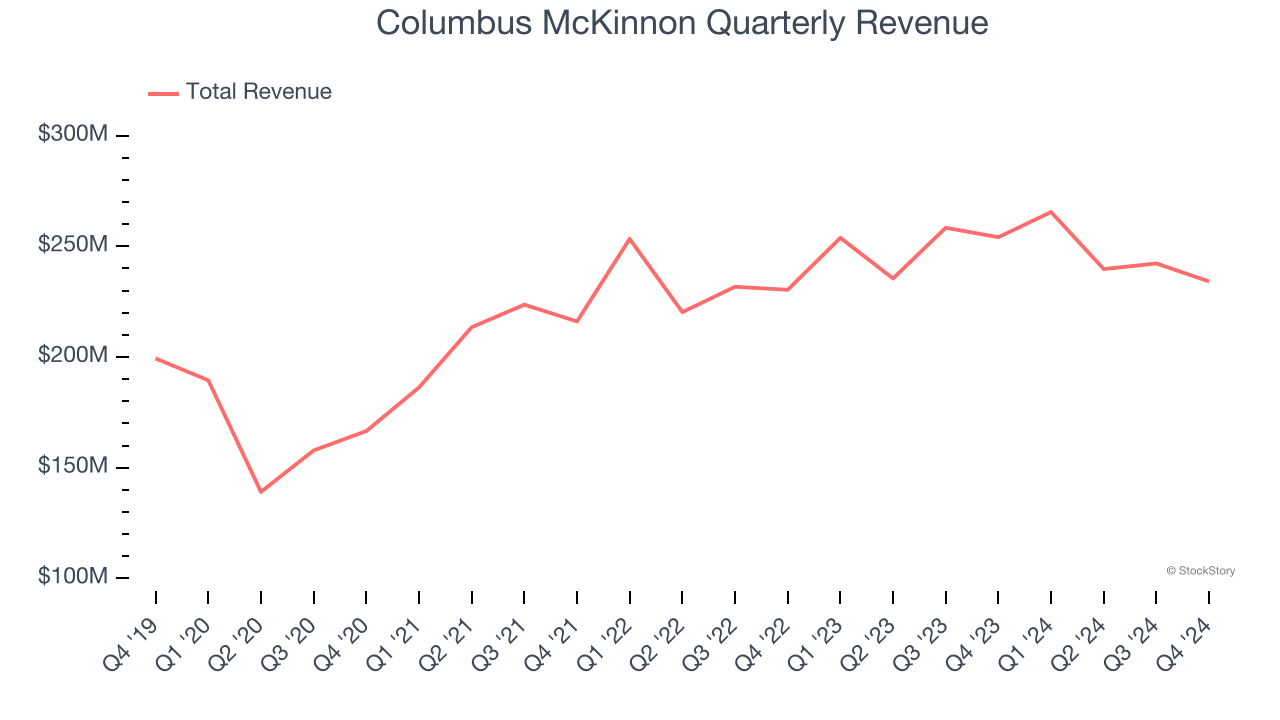
2. EPS Trending Down
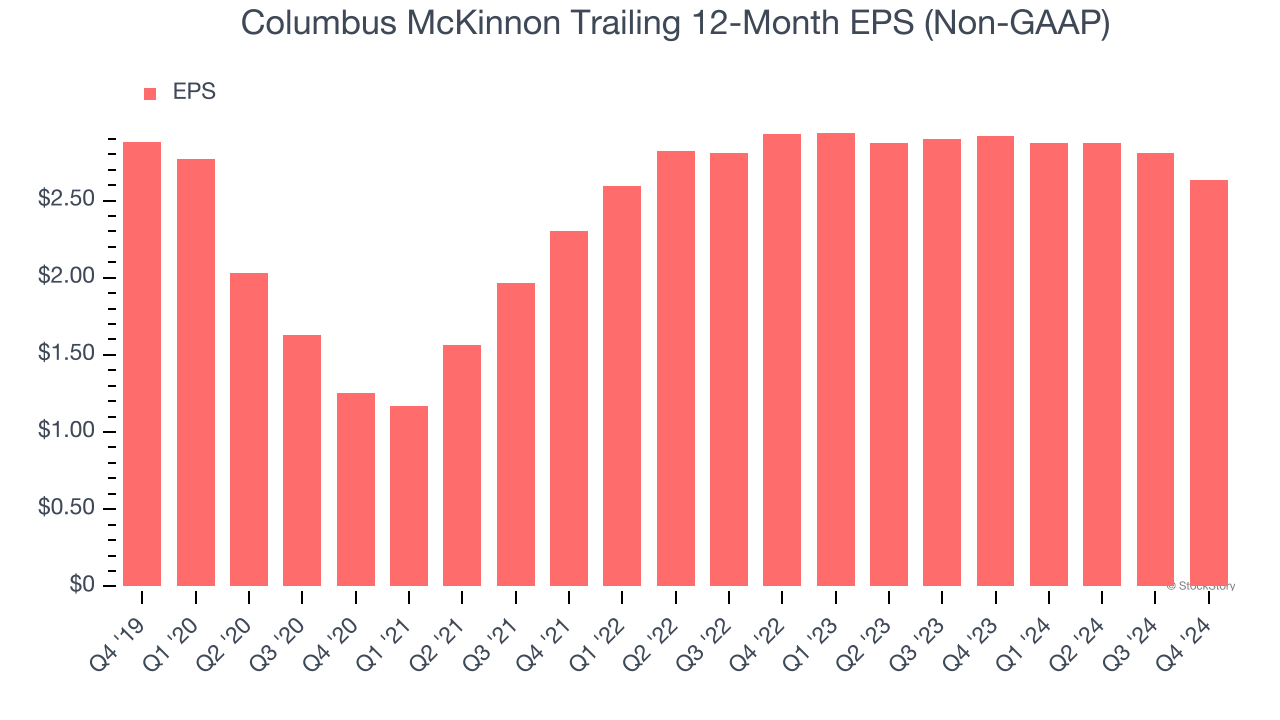
We track the long-term change in earnings per share (EPS) because it highlights whether a company’s growth is profitable.
Sadly for Columbus McKinnon, its EPS declined by 1.8% annually over the last five years while its revenue grew by 3.3%. This tells us the company became less profitable on a per-share basis as it expanded.
3. Free Cash Flow Margin Dropping
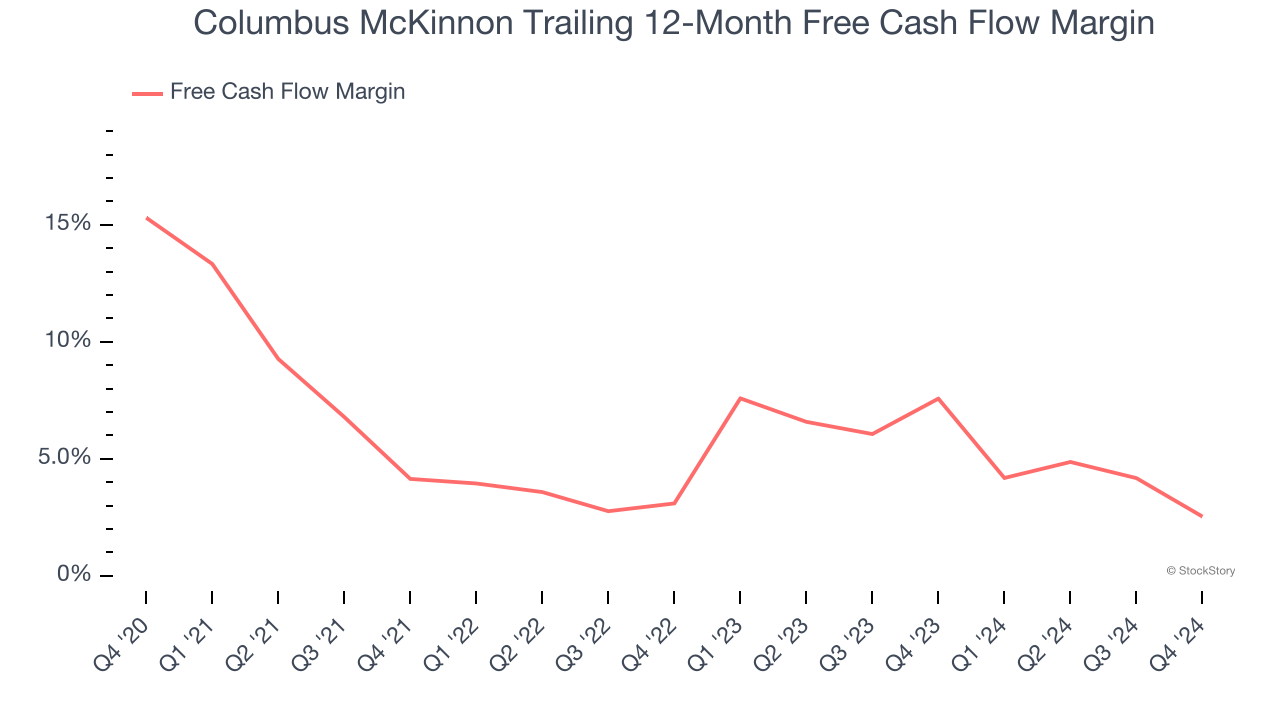
Free cash flow isn't a prominently featured metric in company financials and earnings releases, but we think it's telling because it accounts for all operating and capital expenses, making it tough to manipulate. Cash is king.
As you can see below, Columbus McKinnon’s margin dropped by 12.8 percentage points over the last five years. This along with its unexciting margin put the company in a tough spot, and shareholders are likely hoping it can reverse course. If the trend continues, it could signal it’s becoming a more capital-intensive business. Columbus McKinnon’s free cash flow margin for the trailing 12 months was 2.5%.
Final Judgment
We see the value of companies helping their customers, but in the case of Columbus McKinnon, we’re out. Following the recent decline, the stock trades at 5.6× forward price-to-earnings (or $17.94 per share). While this valuation is optically cheap, the potential downside is huge given its shaky fundamentals. There are superior stocks to buy right now. Let us point you toward an all-weather company that owns household favorite Taco Bell.
Stocks We Would Buy Instead of Columbus McKinnon
With rates dropping, inflation stabilizing, and the elections in the rearview mirror, all signs point to the start of a new bull run - and we’re laser-focused on finding the best stocks for this upcoming cycle.
Put yourself in the driver’s seat by checking out our Top 9 Market-Beating Stocks. This is a curated list of our High Quality stocks that have generated a market-beating return of 175% over the last five years.
Stocks that made our list in 2019 include now familiar names such as Nvidia (+2,183% between December 2019 and December 2024) as well as under-the-radar businesses like Sterling Infrastructure (+1,096% five-year return). Find your next big winner with StockStory today for free.