Educational publishing and media company Scholastic (NASDAQ: SCHL) missed Wall Street’s revenue expectations in Q1 CY2025 as sales rose 3.6% year on year to $335.4 million. Its GAAP loss of $0.13 per share was 83.3% above analysts’ consensus estimates.
Is now the time to buy Scholastic? Find out by accessing our full research report, it’s free.
Scholastic (SCHL) Q1 CY2025 Highlights:
- Revenue: $335.4 million vs analyst estimates of $347.7 million (3.6% year-on-year growth, 3.5% miss)
- EPS (GAAP): -$0.13 vs analyst estimates of -$0.78 (83.3% beat)
- Adjusted EBITDA: $6 million vs analyst estimates of -$1.59 million (1.8% margin, significant beat)
- EBITDA guidance for the full year is $140 million at the midpoint, below analyst estimates of $149.3 million
- Operating Margin: -7.1%, up from -10.5% in the same quarter last year
- Free Cash Flow was -$30.7 million compared to -$7.1 million in the same quarter last year
- Market Capitalization: $538.1 million
Peter Warwick, President and Chief Executive Officer, said, "Scholastic achieved modest revenue growth and improved operating results in the third quarter. Despite increasing pressure on family and school spending on books and educational materials, strong performance by School Book Fairs and Clubs, successful new titles and the addition of 9 Story Media Group contributed to positive results, underscoring Scholastic's unique strengths engaging kids with great books and quality children's media."
Company Overview
Creator of the legendary Scholastic Book Fair, Scholastic (NASDAQ: SCHL) is an international company specializing in children's publishing, education, and media services.
Media
The advent of the internet changed how shows, films, music, and overall information flow. As a result, many media companies now face secular headwinds as attention shifts online. Some have made concerted efforts to adapt by introducing digital subscriptions, podcasts, and streaming platforms. Time will tell if their strategies succeed and which companies will emerge as the long-term winners.
Sales Growth
Reviewing a company’s long-term sales performance reveals insights into its quality. Even a bad business can shine for one or two quarters, but a top-tier one grows for years. Unfortunately, Scholastic struggled to consistently increase demand as its $1.59 billion of sales for the trailing 12 months was close to its revenue five years ago. This wasn’t a great result and suggests it’s a lower quality business.
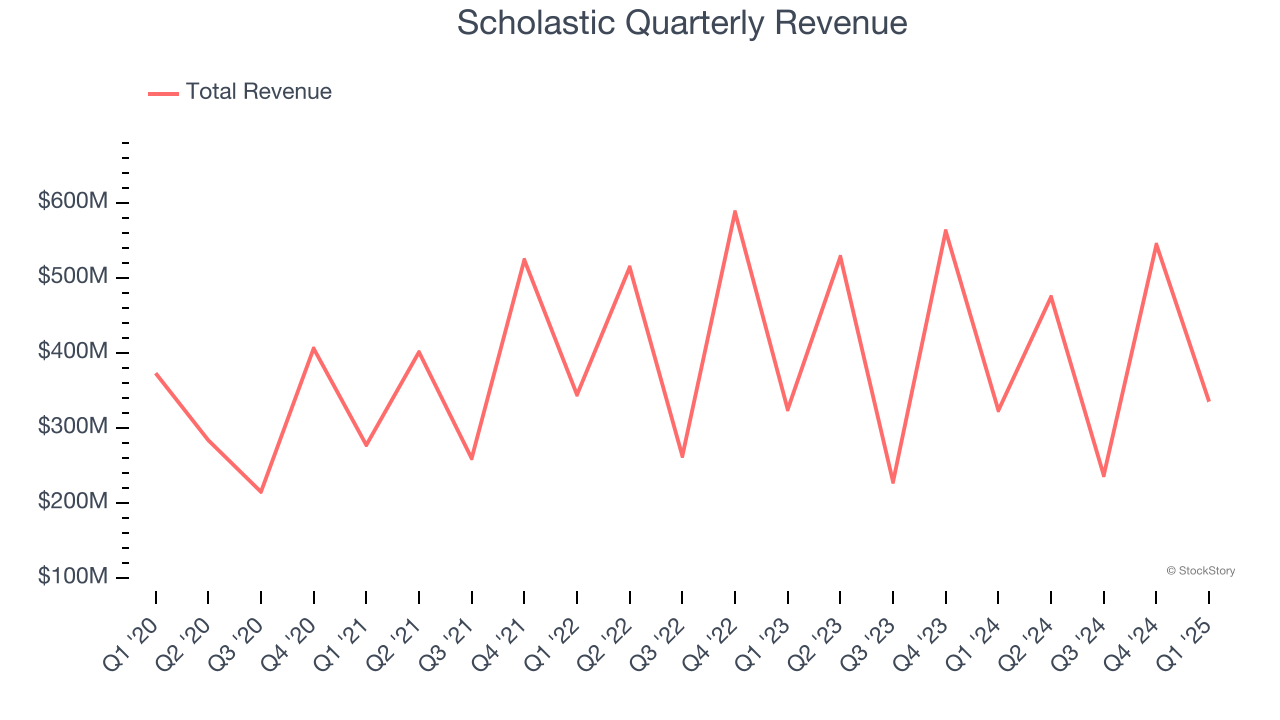
We at StockStory place the most emphasis on long-term growth, but within consumer discretionary, a stretched historical view may miss a company riding a successful new product or trend. Scholastic’s recent history shows its demand remained suppressed as its revenue has declined by 2.9% annually over the last two years. 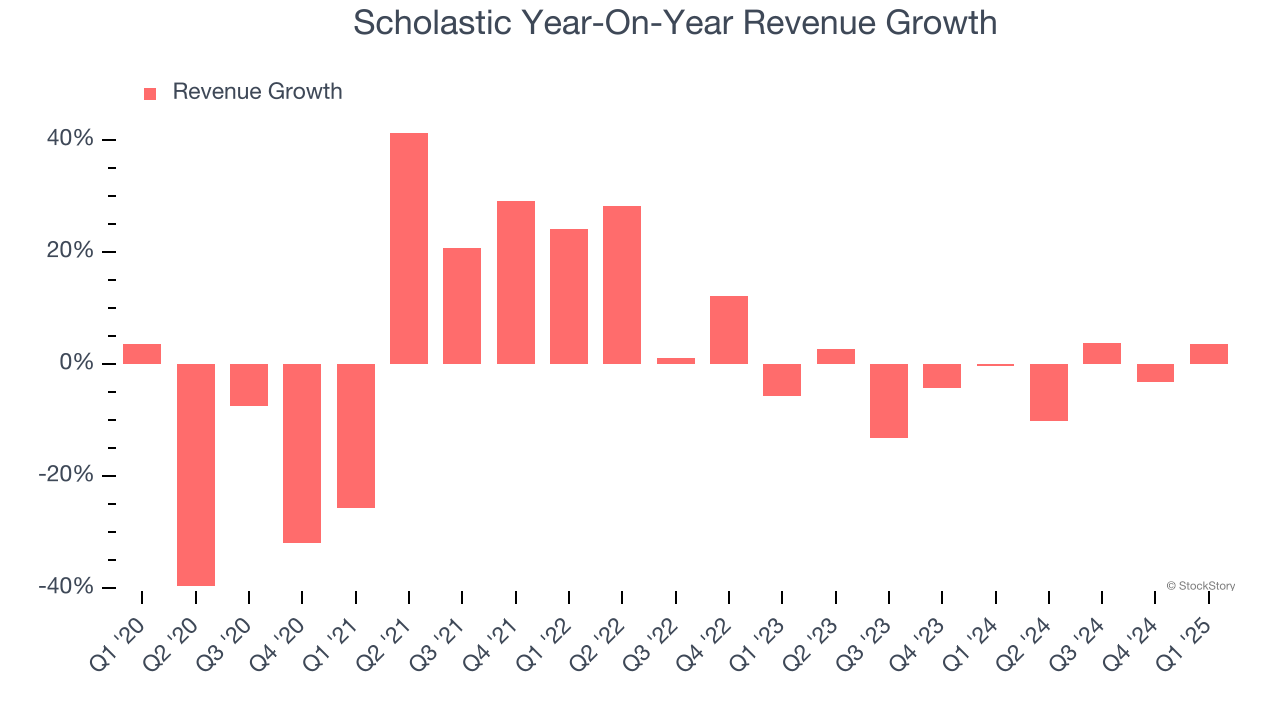
This quarter, Scholastic’s revenue grew by 3.6% year on year to $335.4 million, falling short of Wall Street’s estimates.
Looking ahead, sell-side analysts expect revenue to grow 7.2% over the next 12 months. Although this projection indicates its newer products and services will spur better top-line performance, it is still below average for the sector.
Unless you’ve been living under a rock, it should be obvious by now that generative AI is going to have a huge impact on how large corporations do business. While Nvidia and AMD are trading close to all-time highs, we prefer a lesser-known (but still profitable) stock benefiting from the rise of AI. Click here to access our free report one of our favorites growth stories.
Operating Margin
Scholastic’s operating margin has been trending down over the last 12 months and averaged 2.9% over the last two years. The company’s profitability was mediocre for a consumer discretionary business and shows it couldn’t pass its higher operating expenses onto its customers.
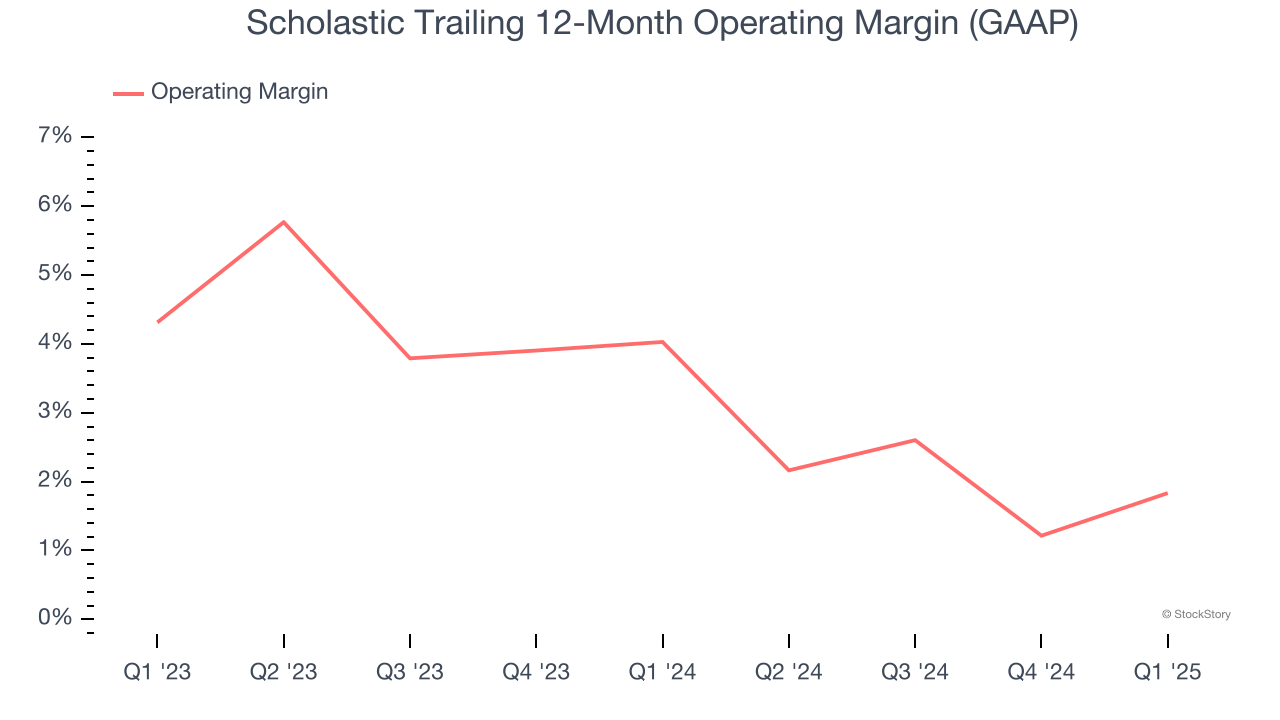
This quarter, Scholastic generated an operating profit margin of negative 7.1%, up 3.3 percentage points year on year. This increase was a welcome development and shows it was more efficient.
Earnings Per Share
We track the long-term change in earnings per share (EPS) for the same reason as long-term revenue growth. Compared to revenue, however, EPS highlights whether a company’s growth is profitable.
Scholastic’s full-year EPS flipped from negative to positive over the last five years. This is encouraging and shows it’s at a critical moment in its life.
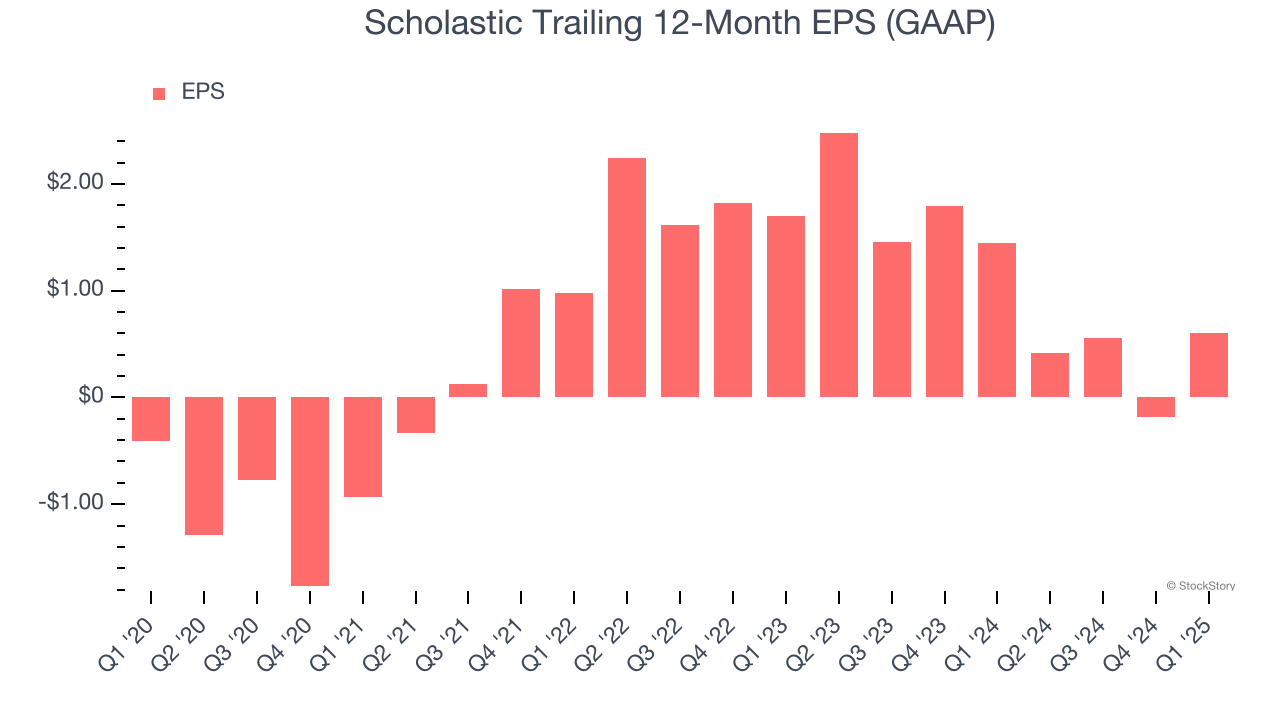
In Q1, Scholastic reported EPS at negative $0.13, up from negative $0.91 in the same quarter last year. This print easily cleared analysts’ estimates, and shareholders should be content with the results. Over the next 12 months, Wall Street expects Scholastic’s full-year EPS of $0.60 to grow 187%.
Key Takeaways from Scholastic’s Q1 Results
We were impressed by how significantly Scholastic blew past analysts’ EPS expectations this quarter. We were also excited its EBITDA outperformed Wall Street’s estimates by a wide margin. On the other hand, its revenue missed and its full-year EBITDA guidance fell short of Wall Street’s estimates. Zooming out, we think this was a decent quarter featuring some areas of strength but also some blemishes. The stock traded up 3.8% to $19.50 immediately after reporting.
Is Scholastic an attractive investment opportunity at the current price? What happened in the latest quarter matters, but not as much as longer-term business quality and valuation, when deciding whether to invest in this stock. We cover that in our actionable full research report which you can read here, it’s free.