Over the past six months, Lamb Weston’s shares (currently trading at $54.42) have posted a disappointing 18.2% loss while the S&P 500 was flat. This was partly due to its softer quarterly results and may have investors wondering how to approach the situation.
Following the drawdown, is now the time to buy LW? Find out in our full research report, it’s free.
Why Does LW Stock Spark Debate?
Best known for its Grown in Idaho brand, Lamb Weston (NYSE: LW) produces and distributes potato products such as frozen french fries and mashed potatoes.
Two Things to Like:
1. Elevated Demand Drives Higher Sales Volumes
Revenue growth can be broken down into changes in price and volume (the number of units sold). While both are important, volume is the lifeblood of a successful staples business as there’s a ceiling to what consumers will pay for everyday goods; they can always trade down to non-branded products if the branded versions are too expensive.
Lamb Weston’s average quarterly volume growth was a robust 8.4% over the last two years. This is good because meaningful volume growth is hard to come by in the stable consumer staples sector. 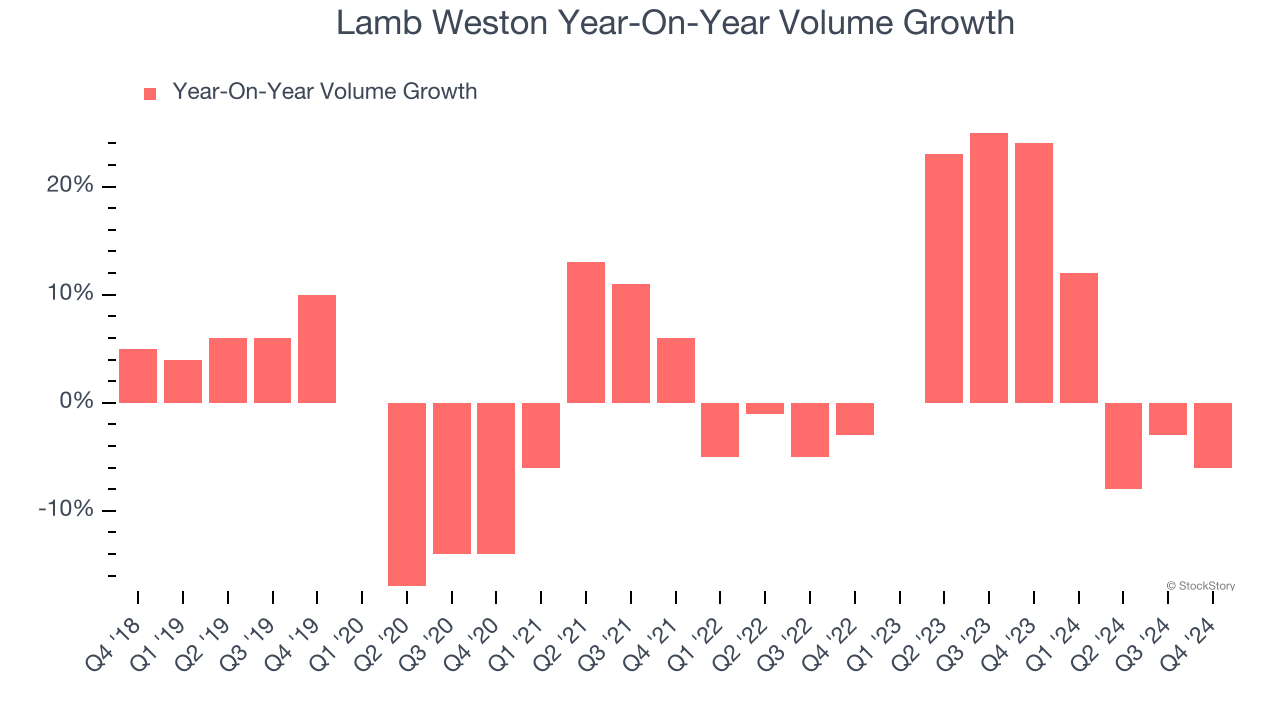
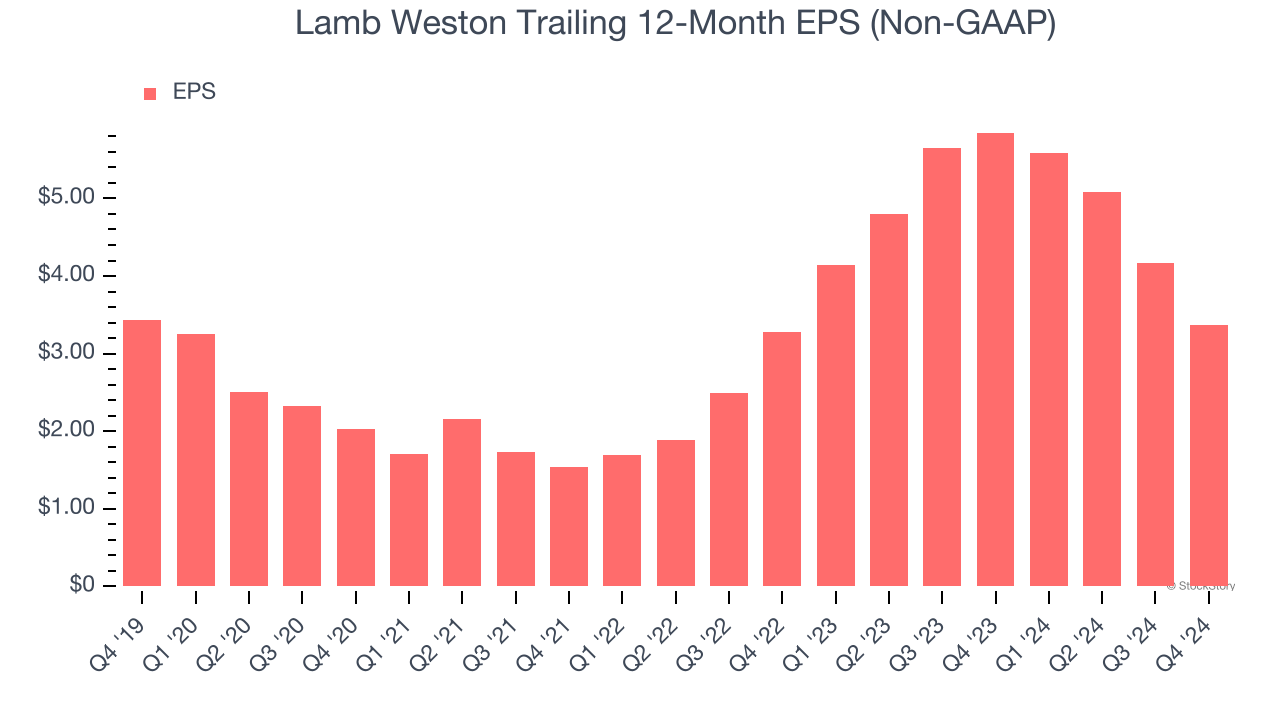
2. Outstanding Long-Term EPS Growth
Analyzing the change in earnings per share (EPS) shows whether a company's incremental sales were profitable – for example, revenue could be inflated through excessive spending on advertising and promotions.
Lamb Weston’s EPS grew at an astounding 29.9% compounded annual growth rate over the last three years, higher than its 17.5% annualized revenue growth. This tells us the company became more profitable on a per-share basis as it expanded.
One Reason to be Careful:
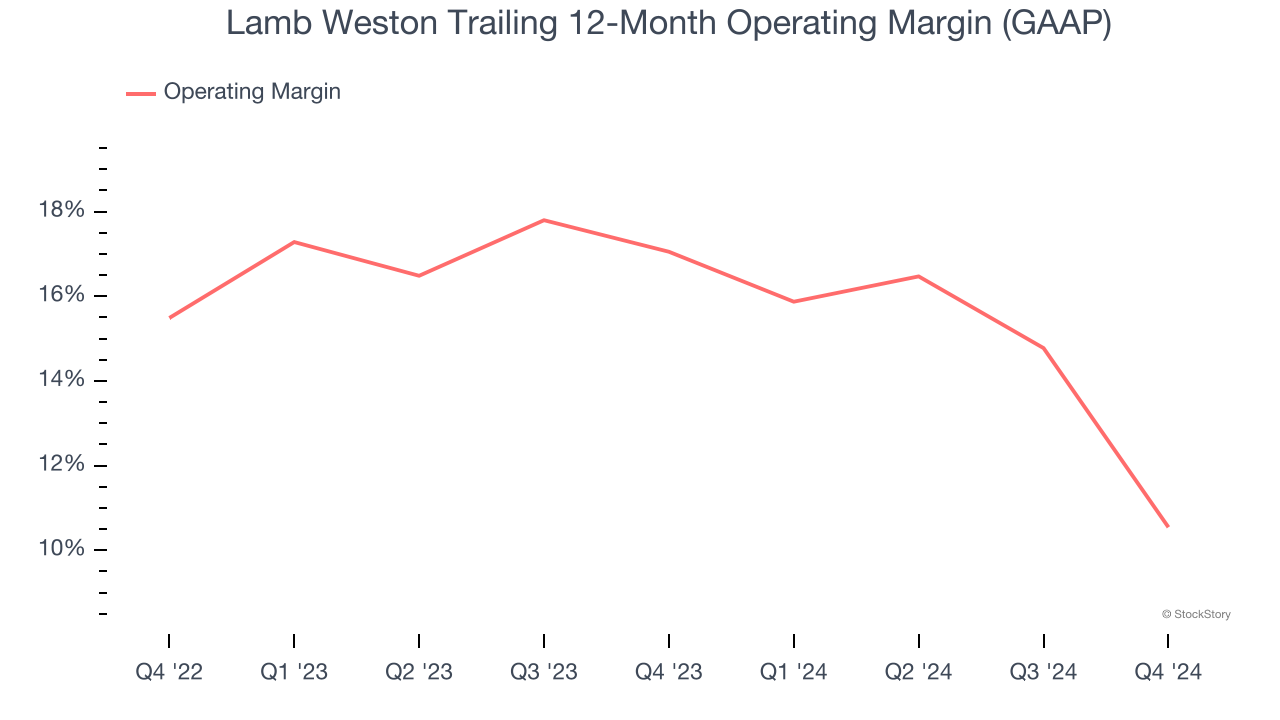
Shrinking Operating Margin
Operating margin is an important measure of profitability accounting for key expenses such as marketing and advertising, IT systems, wages, and other administrative costs.
Looking at the trend in its profitability, Lamb Weston’s operating margin decreased by 6.5 percentage points over the last year. This raises questions about the company’s expense base because its revenue growth should have given it leverage on its fixed costs, resulting in better economies of scale and profitability. Its operating margin for the trailing 12 months was 10.5%.
Final Judgment
Lamb Weston’s merits more than compensate for its flaws. After the recent drawdown, the stock trades at 11.2× forward price-to-earnings (or $54.42 per share). Is now the right time to buy? See for yourself in our full research report, it’s free.
Stocks We Like Even More Than Lamb Weston
The Trump trade may have passed, but rates are still dropping and inflation is still cooling. Opportunities are ripe for those ready to act - and we’re here to help you pick them.
Get started by checking out our Top 5 Growth Stocks for this month. This is a curated list of our High Quality stocks that have generated a market-beating return of 175% over the last five years.
Stocks that made our list in 2019 include now familiar names such as Nvidia (+2,183% between December 2019 and December 2024) as well as under-the-radar businesses like Sterling Infrastructure (+1,096% five-year return). Find your next big winner with StockStory today for free.