Integral Ad Science’s stock price has taken a beating over the past six months, shedding 22.3% of its value and falling to $8.40 per share. This may have investors wondering how to approach the situation.
Following the drawdown, is now an opportune time to buy IAS? Find out in our full research report, it’s free.
Why Does IAS Stock Spark Debate?
Founded in 2009, Integral Ad Science (NASDAQ: IAS) provides digital advertising verification and optimization solutions, ensuring that ads are viewable by real people in brand-safe environments across various platforms and devices.
Two Positive Attributes:
1. Customer Acquisition Costs Are Recovered in Record Time
The customer acquisition cost (CAC) payback period measures the months a company needs to recoup the money spent on acquiring a new customer. This metric helps assess how quickly a business can break even on its sales and marketing investments.
Integral Ad Science is extremely efficient at acquiring new customers, and its CAC payback period checked in at 8.2 months this quarter. The company’s rapid recovery of its customer acquisition costs means it can attempt to spur growth by increasing its sales and marketing investments.
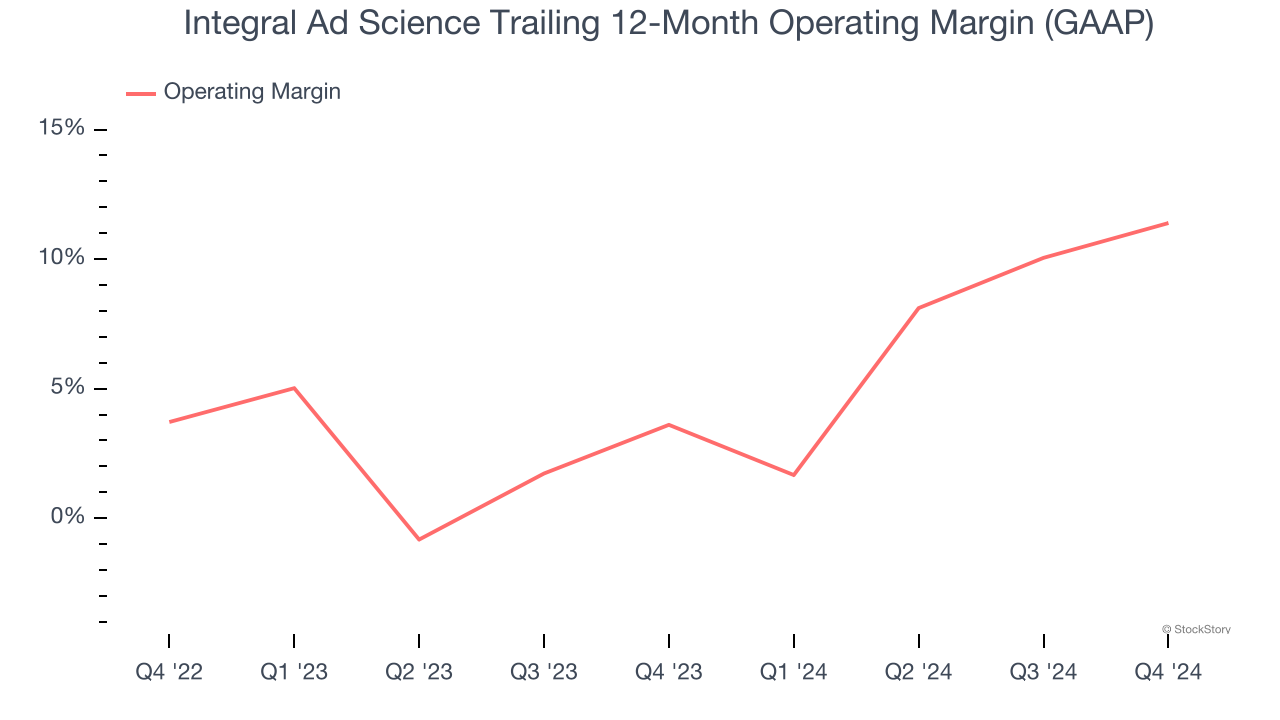
2. Operating Margin Reveals a Well-Run Organization
Many software businesses adjust their profits for stock-based compensation (SBC), but we prioritize GAAP operating margin because SBC is a real expense used to attract and retain engineering and sales talent. This metric shows how much revenue remains after accounting for all core expenses – everything from the cost of goods sold to sales and R&D.
Integral Ad Science has been an efficient company over the last year. It was one of the more profitable businesses in the software sector, boasting an average operating margin of 11.4%. This result isn’t surprising as its high gross margin gives it a favorable starting point.
One Reason to be Careful:
Long-Term Revenue Growth Disappoints
A company’s long-term sales performance can indicate its overall quality. Any business can put up a good quarter or two, but many enduring ones grow for years. Over the last three years, Integral Ad Science grew its sales at a 17.9% compounded annual growth rate. Although this growth is acceptable on an absolute basis, it fell slightly short of our standards for the software sector, which enjoys a number of secular tailwinds. Luckily, there are other things to like about Integral Ad Science. 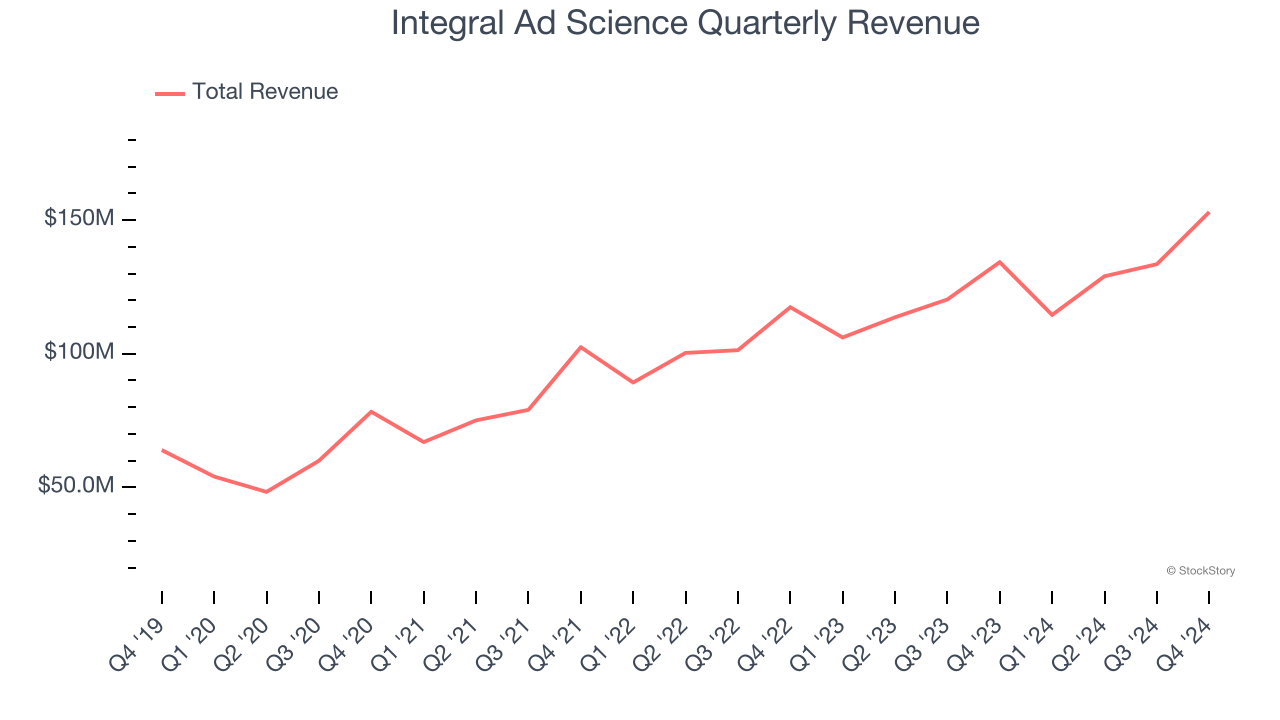
Final Judgment
Integral Ad Science’s merits more than compensate for its flaws. After the recent drawdown, the stock trades at 2.4× forward price-to-sales (or $8.40 per share). Is now a good time to initiate a position? See for yourself in our full research report, it’s free.
Stocks We Like Even More Than Integral Ad Science
With rates dropping, inflation stabilizing, and the elections in the rearview mirror, all signs point to the start of a new bull run - and we’re laser-focused on finding the best stocks for this upcoming cycle.
Put yourself in the driver’s seat by checking out our Top 9 Market-Beating Stocks. This is a curated list of our High Quality stocks that have generated a market-beating return of 175% over the last five years.
Stocks that made our list in 2019 include now familiar names such as Nvidia (+2,183% between December 2019 and December 2024) as well as under-the-radar businesses like Comfort Systems (+751% five-year return). Find your next big winner with StockStory today for free.


