
Shareholders of Cadre would probably like to forget the past six months even happened. The stock dropped 25.4% and now trades at $30.01. This was partly due to its softer quarterly results and may have investors wondering how to approach the situation.
Is now the time to buy Cadre, or should you be careful about including it in your portfolio? Get the full stock story straight from our expert analysts, it’s free.
Despite the more favorable entry price, we're cautious about Cadre. Here are three reasons why CDRE doesn't excite us and a stock we'd rather own.
Why Is Cadre Not Exciting?
Originally known as Safariland, Cadre (NYSE: CDRE) specializes in manufacturing and distributing safety and survivability equipment for first responders.
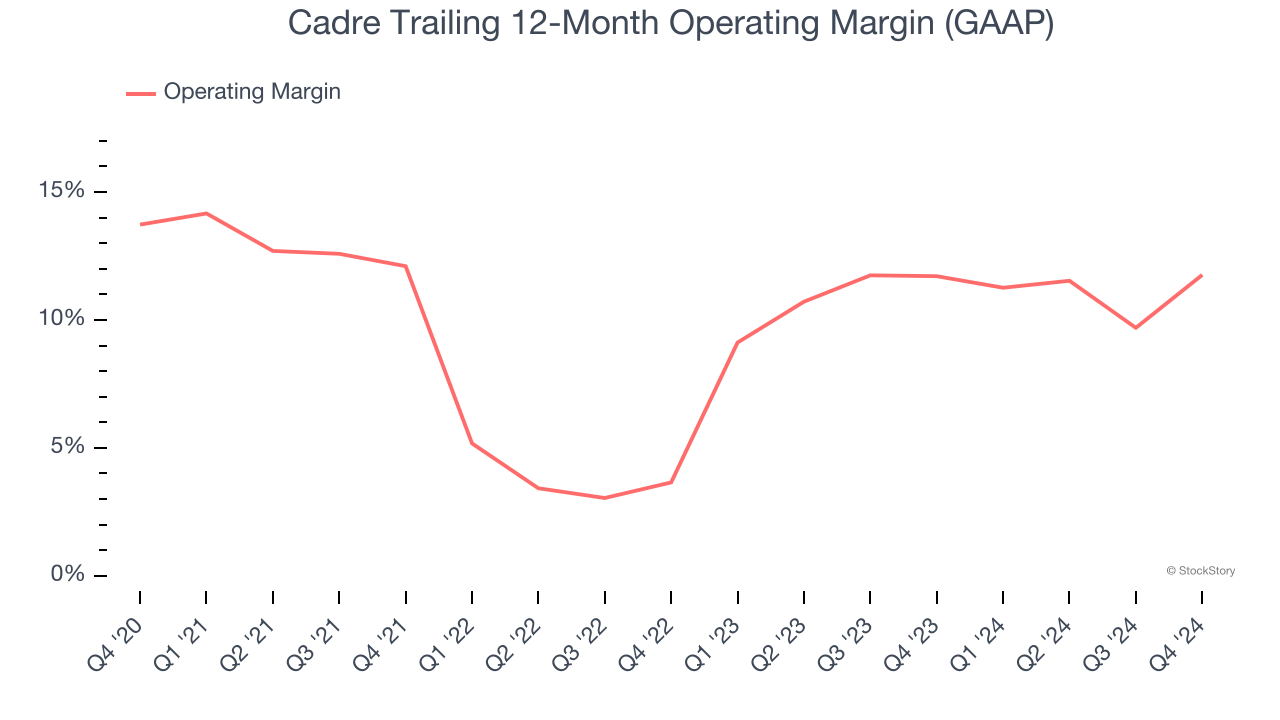
1. Shrinking Operating Margin
Operating margin is an important measure of profitability as it shows the portion of revenue left after accounting for all core expenses – everything from the cost of goods sold to advertising and wages. It’s also useful for comparing profitability across companies with different levels of debt and tax rates because it excludes interest and taxes.
Looking at the trend in its profitability, Cadre’s operating margin decreased by 2 percentage points over the last five years. This raises questions about the company’s expense base because its revenue growth should have given it leverage on its fixed costs, resulting in better economies of scale and profitability. Its operating margin for the trailing 12 months was 11.8%.
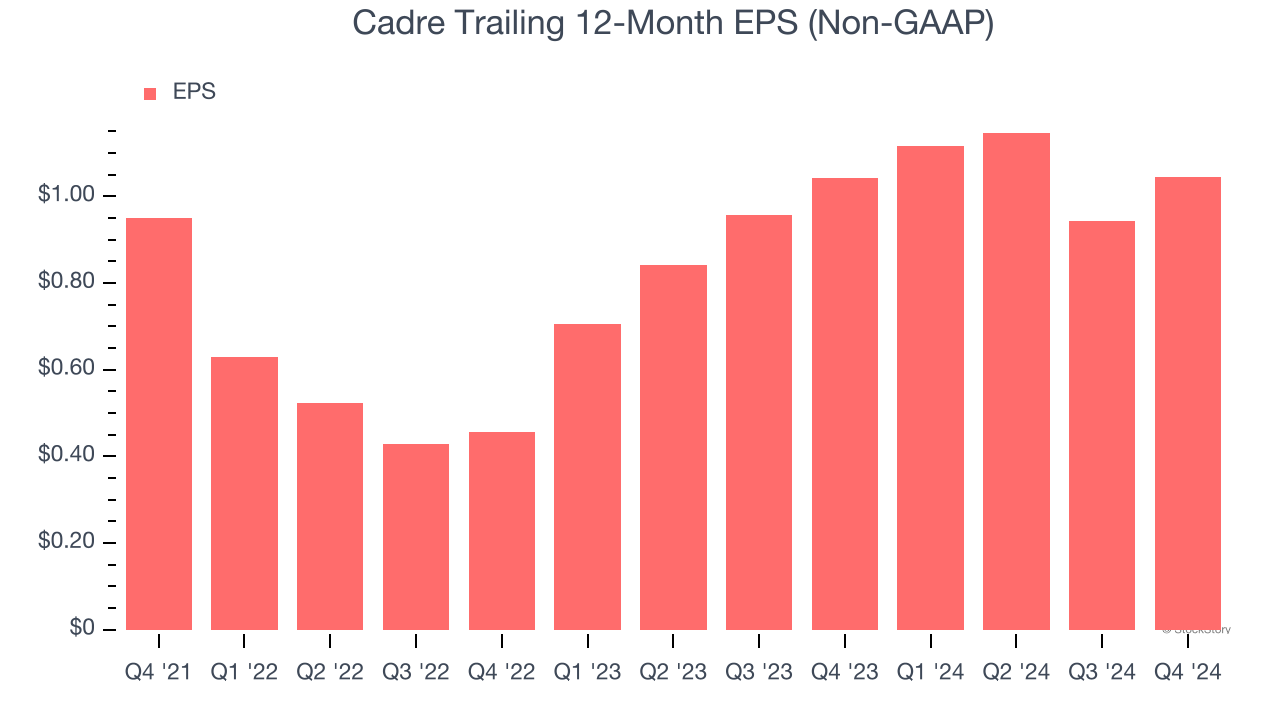
2. EPS Barely Growing
We track the change in earnings per share (EPS) because it highlights whether a company’s growth is profitable.
Cadre’s full-year EPS grew at a weak 3.2% compounded annual growth rate over the last three years, worse than the broader industrials sector.
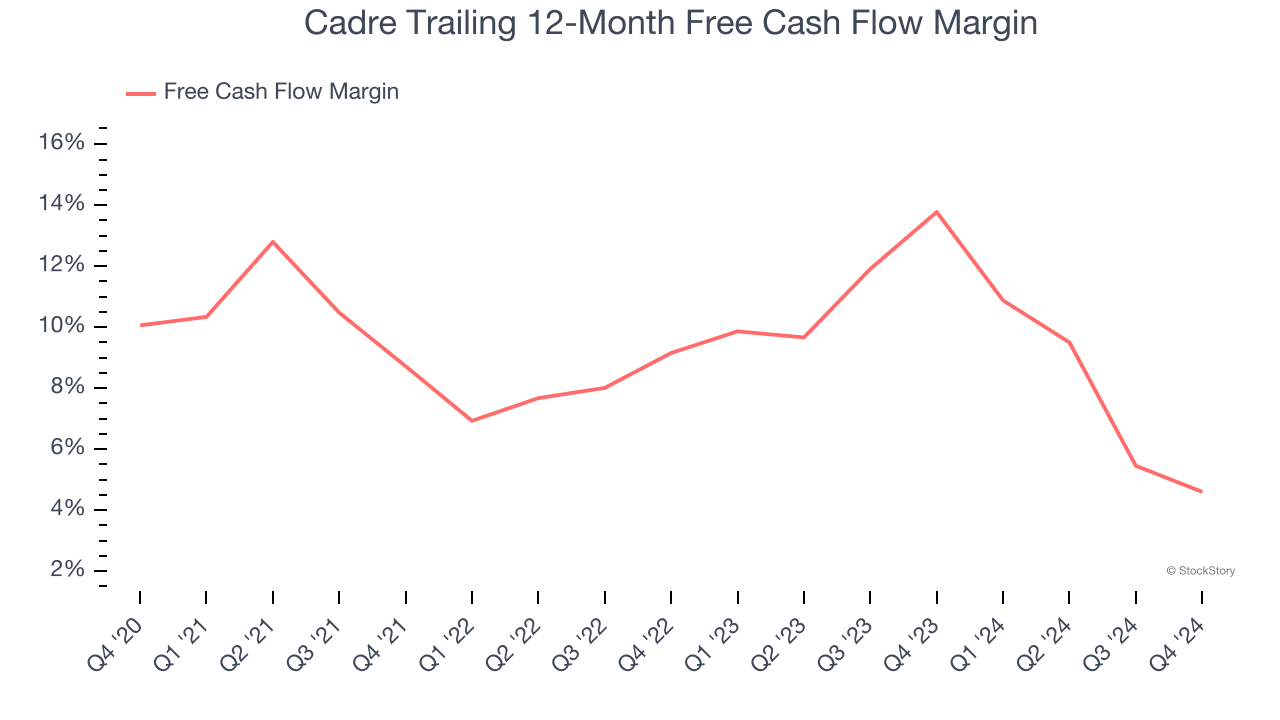
3. Free Cash Flow Margin Dropping
If you’ve followed StockStory for a while, you know we emphasize free cash flow. Why, you ask? We believe that in the end, cash is king, and you can’t use accounting profits to pay the bills.
As you can see below, Cadre’s margin dropped by 5.5 percentage points over the last five years. If its declines continue, it could signal increasing investment needs and capital intensity. Cadre’s free cash flow margin for the trailing 12 months was 4.6%.
Final Judgment
Cadre isn’t a terrible business, but it isn’t one of our picks. After the recent drawdown, the stock trades at 10.5× forward EV-to-EBITDA (or $30.01 per share). Beauty is in the eye of the beholder, but we don’t really see a big opportunity at the moment. We're pretty confident there are superior stocks to buy right now. We’d suggest looking at one of Charlie Munger’s all-time favorite businesses.
Stocks We Would Buy Instead of Cadre
The market surged in 2024 and reached record highs after Donald Trump’s presidential victory in November, but questions about new economic policies are adding much uncertainty for 2025.
While the crowd speculates what might happen next, we’re homing in on the companies that can succeed regardless of the political or macroeconomic environment. Put yourself in the driver’s seat and build a durable portfolio by checking out our Top 5 Growth Stocks for this month. This is a curated list of our High Quality stocks that have generated a market-beating return of 175% over the last five years.
Stocks that made our list in 2019 include now familiar names such as Nvidia (+2,183% between December 2019 and December 2024) as well as under-the-radar businesses like Sterling Infrastructure (+1,096% five-year return). Find your next big winner with StockStory today for free.


