
Earnings results often indicate what direction a company will take in the months ahead. With Q4 behind us, let’s have a look at SolarEdge (NASDAQ: SEDG) and its peers.
Renewable energy companies are buoyed by the secular trend of green energy that is upending traditional power generation. Those who innovate and evolve with this dynamic market can win share while those who continue to rely on legacy technologies can see diminishing demand, which includes headwinds from increasing regulation against “dirty” energy. Additionally, these companies are at the whim of economic cycles, as interest rates can impact the willingness to invest in renewable energy projects.
The 17 renewable energy stocks we track reported a mixed Q4. As a group, revenues missed analysts’ consensus estimates by 4.6% while next quarter’s revenue guidance was 0.6% above.
Amidst this news, share prices of the companies have had a rough stretch. On average, they are down 21.1% since the latest earnings results.
SolarEdge (NASDAQ: SEDG)
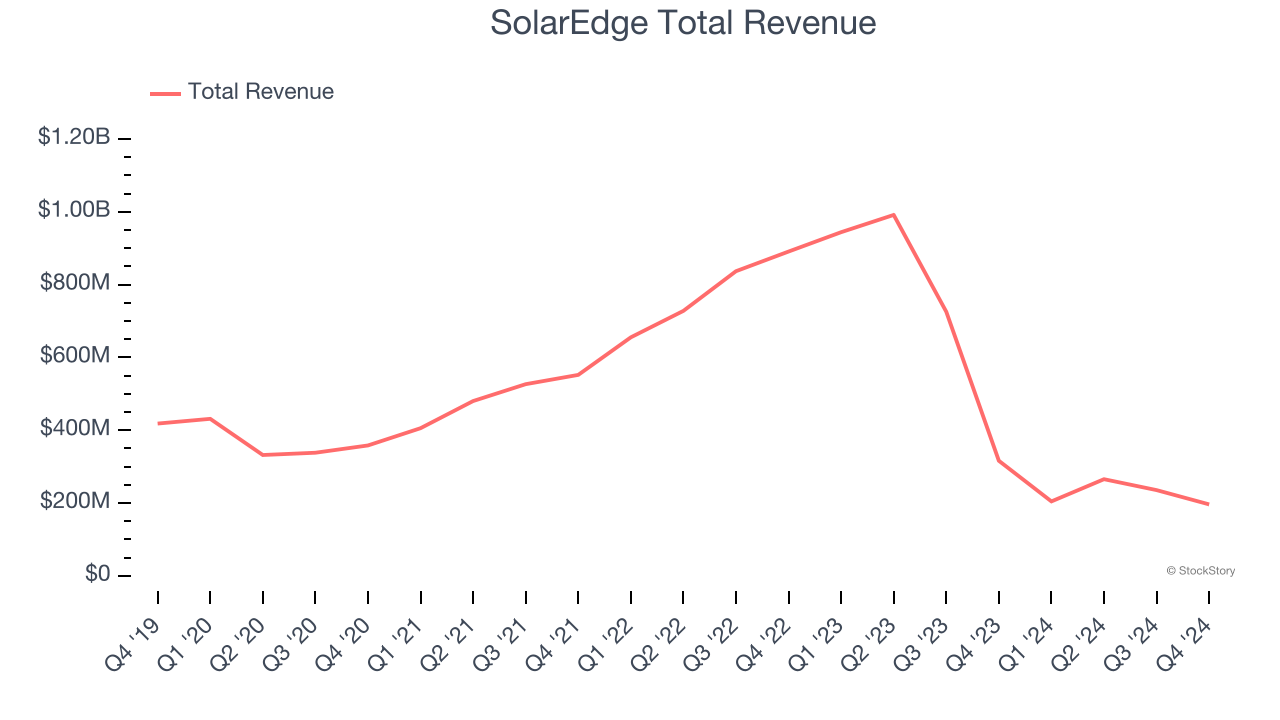
Established in 2006, SolarEdge (NASDAQ: SEDG) creates advanced systems to improve the efficiency of solar panels.
SolarEdge reported revenues of $196.2 million, down 37.9% year on year. This print exceeded analysts’ expectations by 4%. Despite the top-line beat, it was still a decent quarter for the company with a solid beat of analysts’ adjusted operating income estimates.
“There are exciting opportunities ahead for SolarEdge,” said Shuki Nir, CEO of SolarEdge.
The stock is down 16.9% since reporting and currently trades at $14.08.
Read our full report on SolarEdge here, it’s free.
Best Q4: Bloom Energy (NYSE: BE)
Working in stealth mode for eight years, Bloom Energy (NYSE: BE) designs, manufactures, and markets solid oxide fuel cell systems for on-site power generation.
Bloom Energy reported revenues of $572.4 million, up 60.4% year on year, outperforming analysts’ expectations by 12.8%. The business had an incredible quarter with an impressive beat of analysts’ EPS estimates and a solid beat of analysts’ EBITDA estimates.
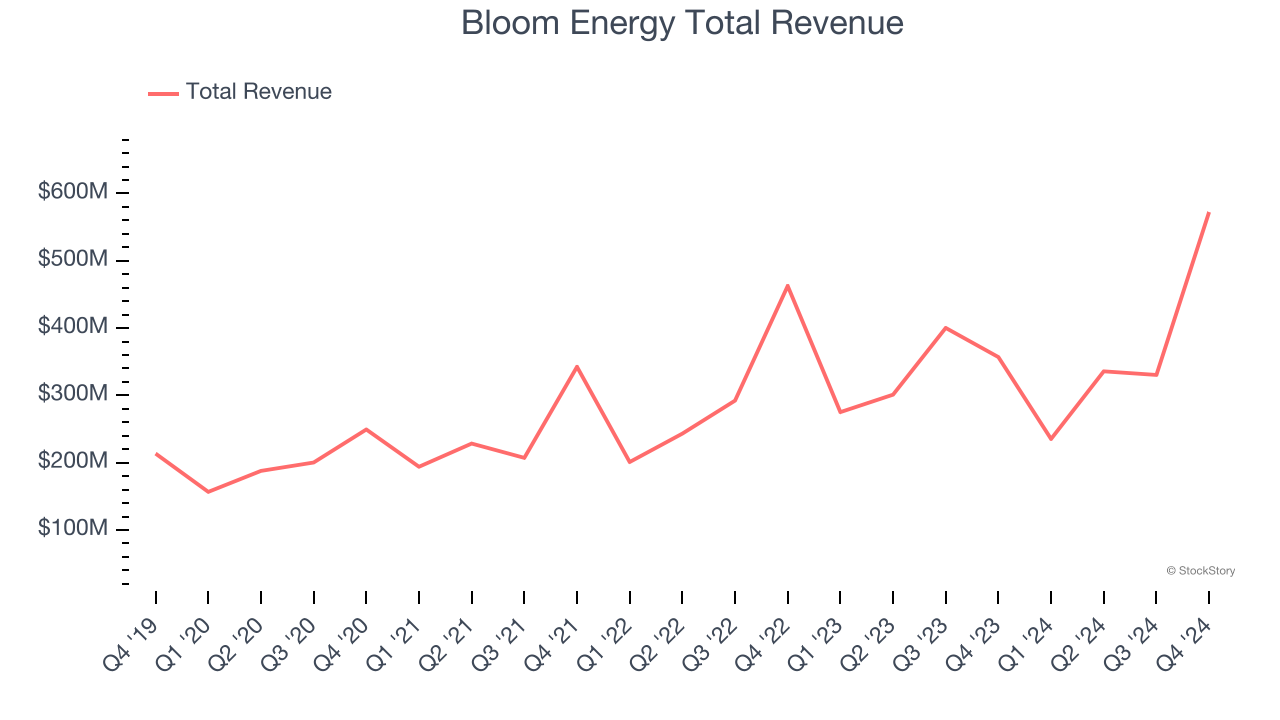
Bloom Energy achieved the biggest analyst estimates beat, fastest revenue growth, and highest full-year guidance raise among its peers. The stock is down 21.9% since reporting. It currently trades at $17.98.
Is now the time to buy Bloom Energy? Access our full analysis of the earnings results here, it’s free.
Weakest Q4: TPI Composites (NASDAQ: TPIC)
Founded in 1968, TPI Composites (NASDAQ: TPIC) manufactures composite wind turbine blades and provides related precision molding and assembly systems.
TPI Composites reported revenues of $346.5 million, up 16.7% year on year, falling short of analysts’ expectations by 5%. It was a disappointing quarter as it posted full-year revenue guidance missing analysts’ expectations.
As expected, the stock is down 37.9% since the results and currently trades at $0.90.
Read our full analysis of TPI Composites’s results here.
FuelCell Energy (NASDAQ: FCEL)
Founded in 1969, FuelCell Energy (NASDAQ: FCEL) is a leading manufacturer and developer of carbonate fuel cell technology for stationary power generation.
FuelCell Energy reported revenues of $19 million, up 13.8% year on year. This print lagged analysts' expectations by 47.6%. It was a softer quarter as it also recorded a significant miss of analysts’ adjusted operating income estimates.
The stock is down 34.6% since reporting and currently trades at $4.16.
Read our full, actionable report on FuelCell Energy here, it’s free.
American Superconductor (NASDAQ: AMSC)
Founded in 1987, American Superconductor (NASDAQ: AMSC) has shifted from superconductor research to developing power systems, adapting to changing energy grid needs and naval technology requirements.
American Superconductor reported revenues of $61.4 million, up 56% year on year. This number topped analysts’ expectations by 8.4%. It was an exceptional quarter as it also recorded a solid beat of analysts’ EPS estimates and an impressive beat of analysts’ EBITDA estimates.
The stock is down 28.9% since reporting and currently trades at $18.20.
Read our full, actionable report on American Superconductor here, it’s free.
Market Update
The Fed’s interest rate hikes throughout 2022 and 2023 have successfully cooled post-pandemic inflation, bringing it closer to the 2% target. Inflationary pressures have eased without tipping the economy into a recession, suggesting a soft landing. This stability, paired with recent rate cuts (0.5% in September 2024 and 0.25% in November 2024), fueled a strong year for the stock market in 2024. The markets surged further after Donald Trump’s presidential victory in November, with major indices reaching record highs in the days following the election. Still, questions remain about the direction of economic policy, as potential tariffs and corporate tax changes add uncertainty for 2025.
Want to invest in winners with rock-solid fundamentals? Check out our Strong Momentum Stocks and add them to your watchlist. These companies are poised for growth regardless of the political or macroeconomic climate.
Join Paid Stock Investor Research
Help us make StockStory more helpful to investors like yourself. Join our paid user research session and receive a $50 Amazon gift card for your opinions. Sign up here.


