
ABM trades at $47.19 per share and has stayed right on track with the overall market, losing 12.4% over the last six months while the S&P 500 is down 8.3%. This might have investors contemplating their next move.
Is now the time to buy ABM, or should you be careful about including it in your portfolio? See what our analysts have to say in our full research report, it’s free.
Despite the more favorable entry price, we're sitting this one out for now. Here are three reasons why you should be careful with ABM and a stock we'd rather own.
Why Do We Think ABM Will Underperform?
With roots dating back to 1909 as a window washing company, ABM Industries (NYSE: ABM) provides integrated facility management, infrastructure, and mobility solutions across various sectors including commercial, manufacturing, education, and aviation.
1. Slow Organic Growth Suggests Waning Demand In Core Business
We can better understand Industrial & Environmental Services companies by analyzing their organic revenue. This metric gives visibility into ABM’s core business because it excludes one-time events such as mergers, acquisitions, and divestitures along with foreign currency fluctuations - non-fundamental factors that can manipulate the income statement.
Over the last two years, ABM’s organic revenue averaged 2.7% year-on-year growth. This performance was underwhelming and suggests it may need to improve its products, pricing, or go-to-market strategy, which can add an extra layer of complexity to its operations. 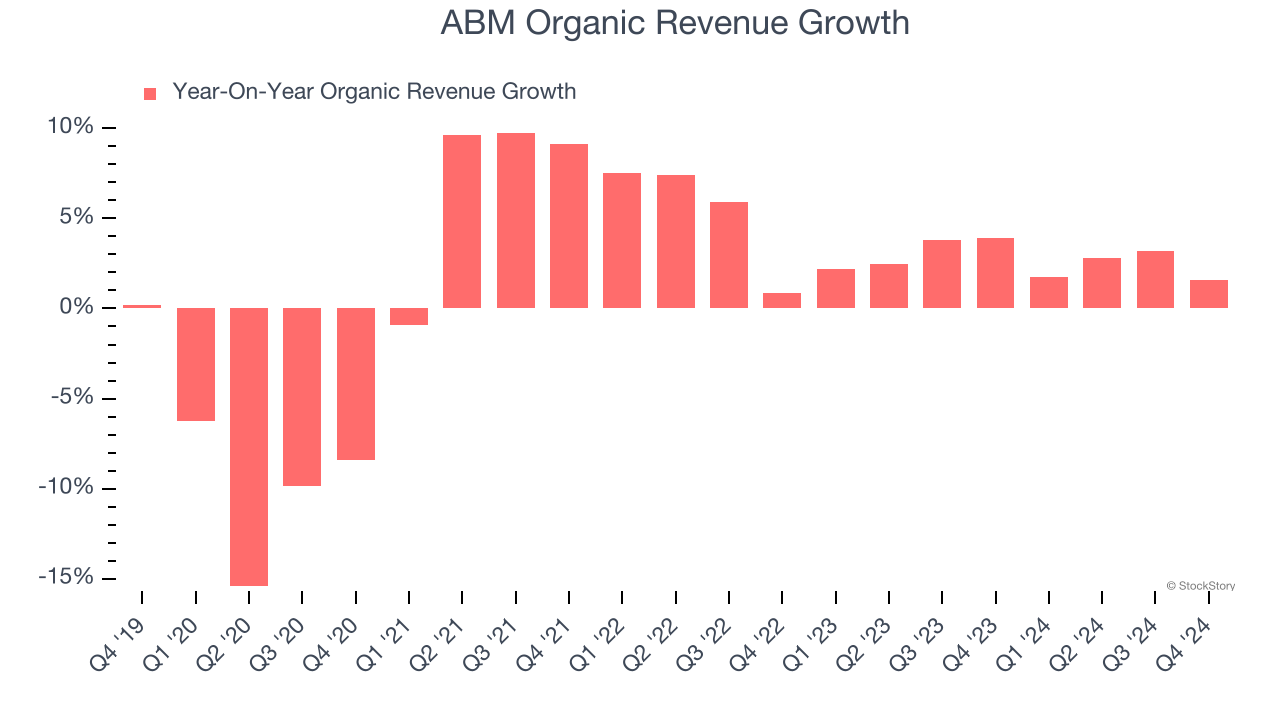
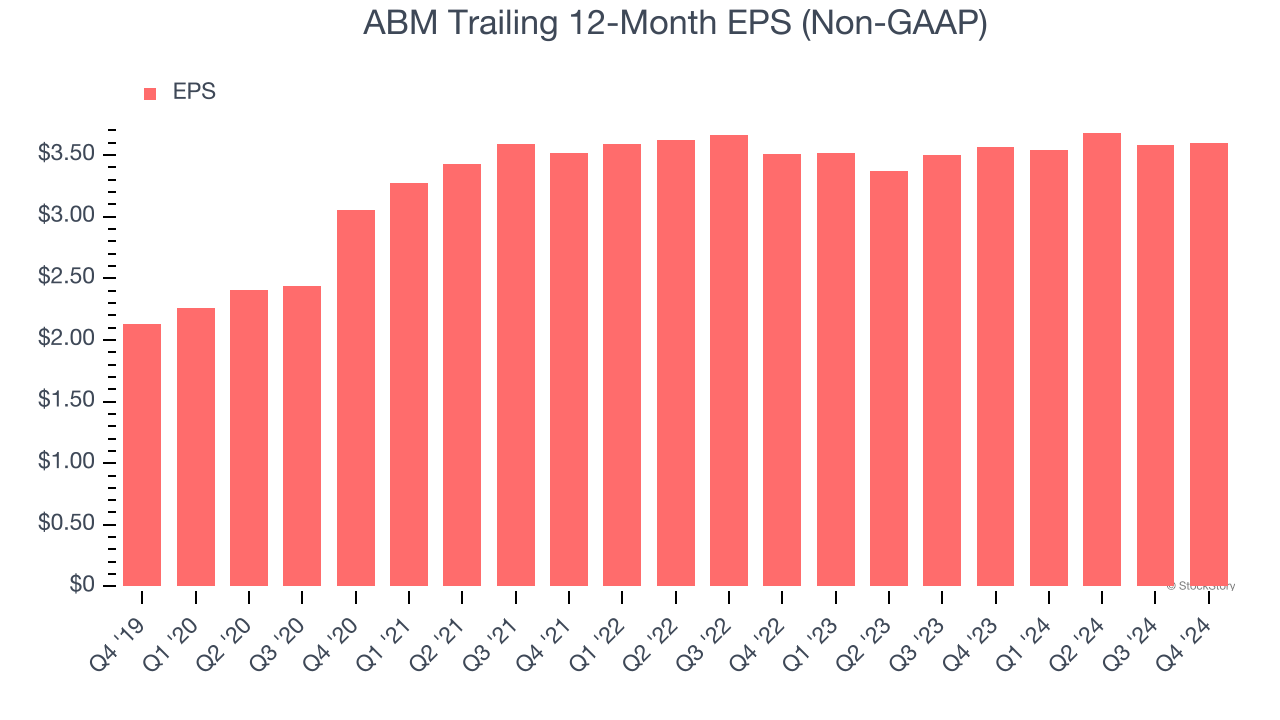
2. Recent EPS Growth Below Our Standards
While long-term earnings trends give us the big picture, we also track EPS over a shorter period because it can provide insight into an emerging theme or development for the business.
ABM’s EPS grew at a weak 1.3% compounded annual growth rate over the last two years, lower than its 3.4% annualized revenue growth. This tells us the company became less profitable on a per-share basis as it expanded.
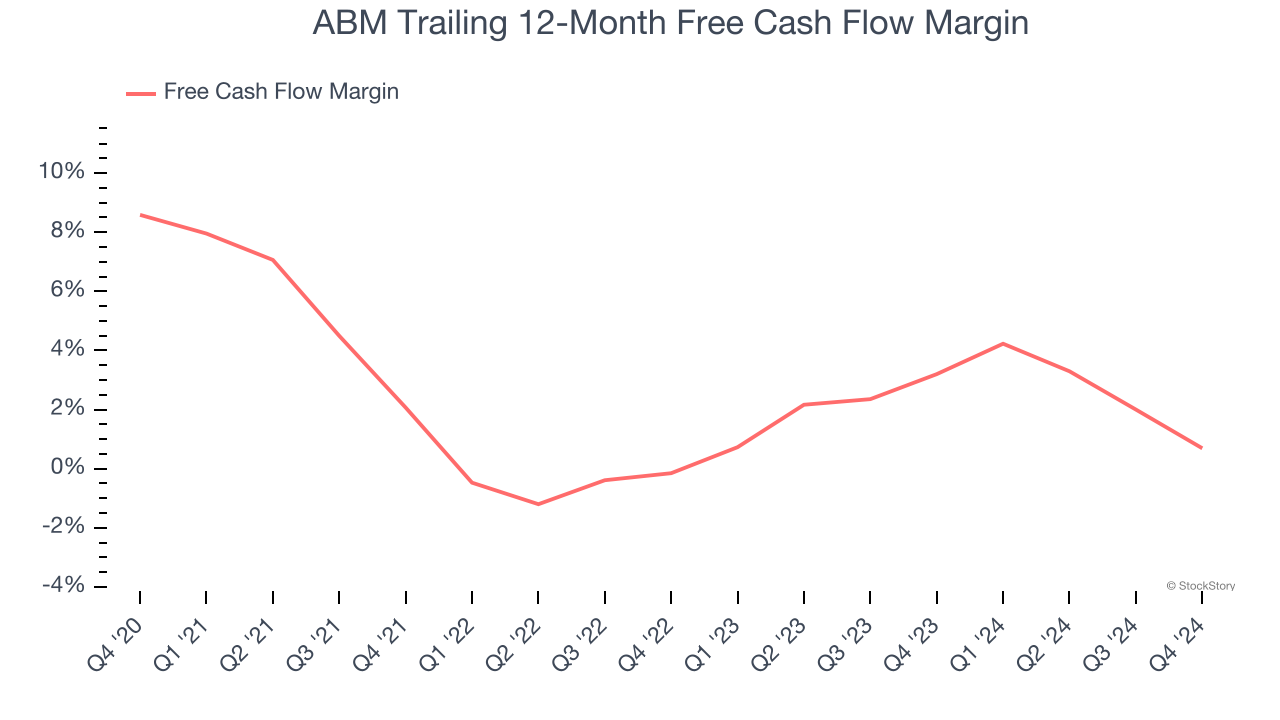
3. Free Cash Flow Margin Dropping
Free cash flow isn't a prominently featured metric in company financials and earnings releases, but we think it's telling because it accounts for all operating and capital expenses, making it tough to manipulate. Cash is king.
As you can see below, ABM’s margin dropped by 7.9 percentage points over the last five years. Almost any movement in the wrong direction is undesirable because of its already low cash conversion. If the trend continues, it could signal it’s becoming a more capital-intensive business. ABM’s free cash flow margin for the trailing 12 months was breakeven.
Final Judgment
ABM falls short of our quality standards. Following the recent decline, the stock trades at 12.3× forward price-to-earnings (or $47.19 per share). This valuation is reasonable, but the company’s shaky fundamentals present too much downside risk. There are more exciting stocks to buy at the moment. Let us point you toward one of Charlie Munger’s all-time favorite businesses.
Stocks We Would Buy Instead of ABM
Market indices reached historic highs following Donald Trump’s presidential victory in November 2024, but the outlook for 2025 is clouded by new trade policies that could impact business confidence and growth.
While this has caused many investors to adopt a "fearful" wait-and-see approach, we’re leaning into our best ideas that can grow regardless of the political or macroeconomic climate. Take advantage of Mr. Market by checking out our Top 5 Strong Momentum Stocks for this week. This is a curated list of our High Quality stocks that have generated a market-beating return of 175% over the last five years.
Stocks that made our list in 2019 include now familiar names such as Nvidia (+2,183% between December 2019 and December 2024) as well as under-the-radar businesses like Sterling Infrastructure (+1,096% five-year return). Find your next big winner with StockStory today for free.


