
NN’s stock price has taken a beating over the past six months, shedding 59.3% of its value and falling to $1.70 per share. This might have investors contemplating their next move.
Is now the time to buy NN, or should you be careful about including it in your portfolio? Get the full stock story straight from our expert analysts, it’s free.
Even though the stock has become cheaper, we're swiping left on NN for now. Here are three reasons why there are better opportunities than NNBR and a stock we'd rather own.
Why Do We Think NN Will Underperform?
Formerly known as Nuturn, NN (NASDAQ: NNBR) provides metal components, bearings, and plastic and rubber components to the automotive, aerospace, medical, and industrial sectors.
1. Long-Term Revenue Growth Flatter Than a Pancake
A company’s long-term sales performance is one signal of its overall quality. Any business can put up a good quarter or two, but the best consistently grow over the long haul. Unfortunately, NN struggled to consistently increase demand as its $464.3 million of sales for the trailing 12 months was close to its revenue five years ago. This was below our standards and is a sign of poor business quality. 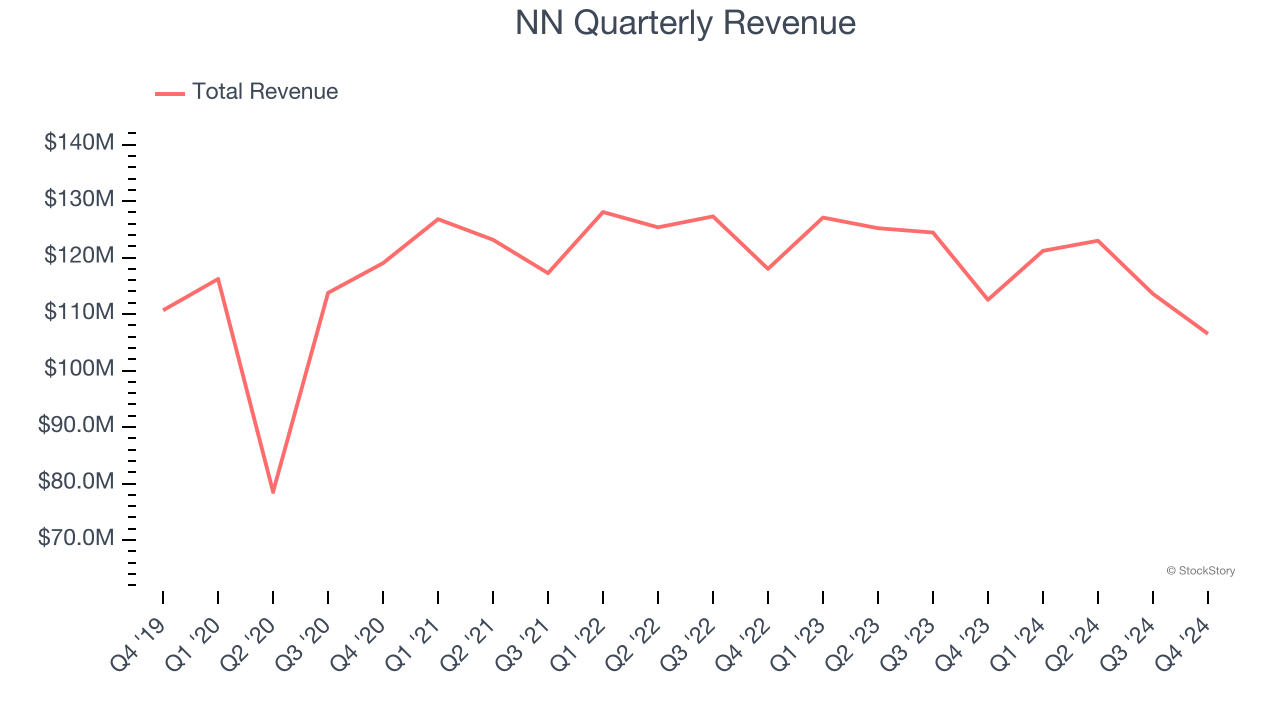
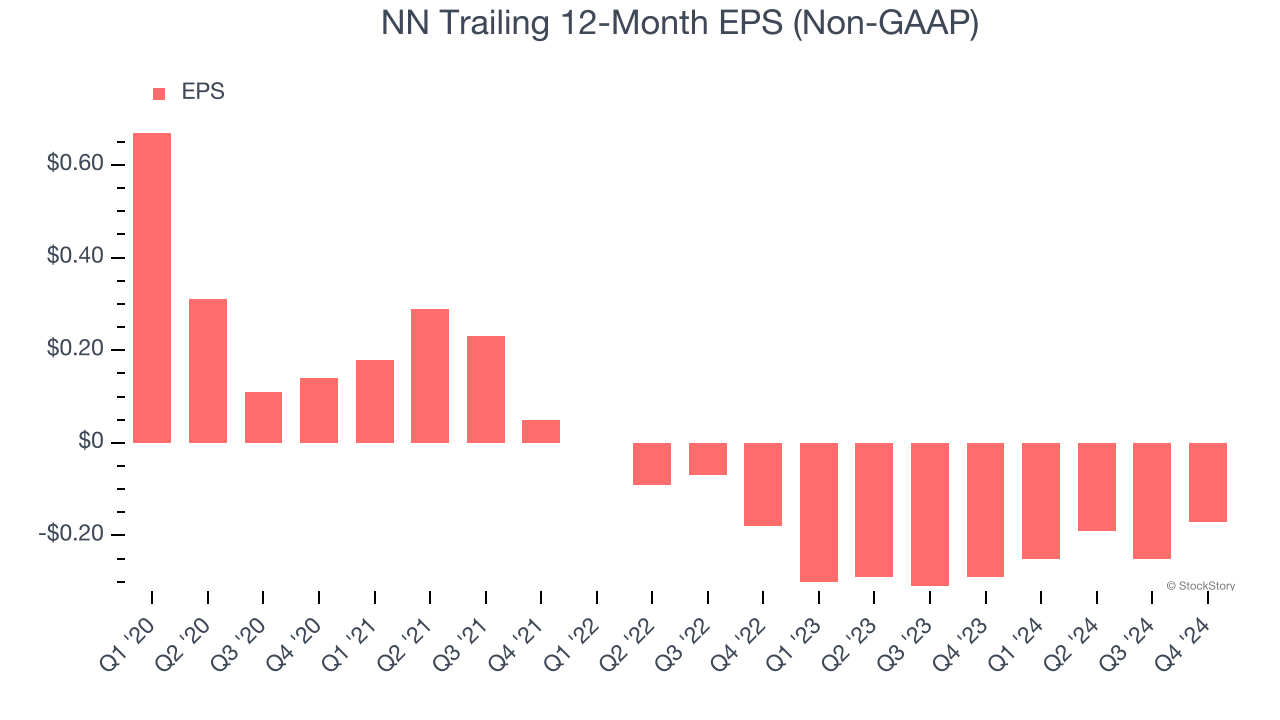
2. EPS Trending Down
We track the long-term change in earnings per share (EPS) because it highlights whether a company’s growth is profitable.
Sadly for NN, its EPS declined by 16.4% annually over the last five years while its revenue was flat. This tells us the company struggled because its fixed cost base made it difficult to adjust to choppy demand.
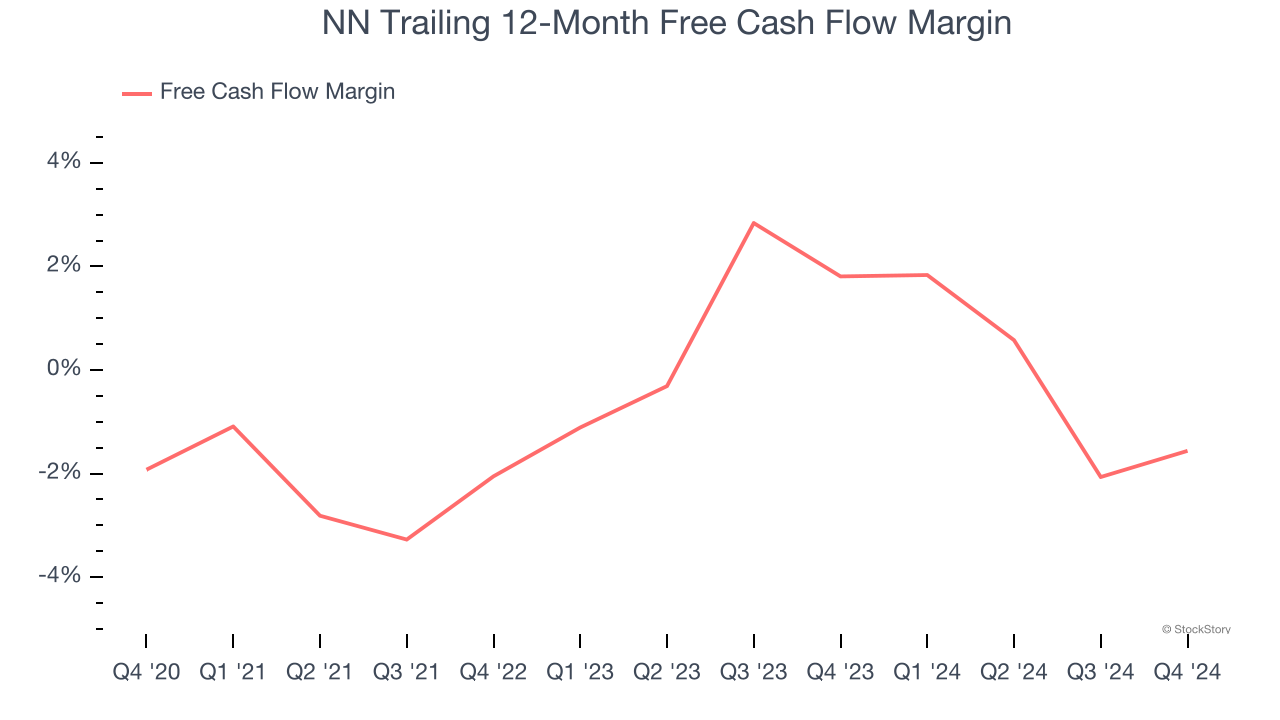
3. Cash Burn Ignites Concerns
Free cash flow isn't a prominently featured metric in company financials and earnings releases, but we think it's telling because it accounts for all operating and capital expenses, making it tough to manipulate. Cash is king.
While NN posted positive free cash flow this quarter, the broader story hasn’t been so clean. NN’s demanding reinvestments have drained its resources over the last five years, putting it in a pinch and limiting its ability to return capital to investors. Its free cash flow margin averaged negative 1.1%, meaning it lit $1.14 of cash on fire for every $100 in revenue.
Final Judgment
We cheer for all companies making their customers lives easier, but in the case of NN, we’ll be cheering from the sidelines. Following the recent decline, the stock trades at 1.6× forward EV-to-EBITDA (or $1.70 per share). While this valuation is optically cheap, the potential downside is huge given its shaky fundamentals. There are better stocks to buy right now. We’d suggest looking at one of Charlie Munger’s all-time favorite businesses.
Stocks We Like More Than NN
The market surged in 2024 and reached record highs after Donald Trump’s presidential victory in November, but questions about new economic policies are adding much uncertainty for 2025.
While the crowd speculates what might happen next, we’re homing in on the companies that can succeed regardless of the political or macroeconomic environment. Put yourself in the driver’s seat and build a durable portfolio by checking out our Top 9 Market-Beating Stocks. This is a curated list of our High Quality stocks that have generated a market-beating return of 175% over the last five years.
Stocks that made our list in 2019 include now familiar names such as Nvidia (+2,183% between December 2019 and December 2024) as well as under-the-radar businesses like Sterling Infrastructure (+1,096% five-year return). Find your next big winner with StockStory today for free.


