Elastic currently trades at $77 per share and has shown little upside over the past six months, posting a small loss of 3%. However, the stock is beating the S&P 500’s 11% decline during that period.
Is there a buying opportunity in Elastic, or does it present a risk to your portfolio? Check out our in-depth research report to see what our analysts have to say, it’s free.
Even with the strong relative performance, we're swiping left on Elastic for now. Here are two reasons why there are better opportunities than ESTC and a stock we'd rather own.
Why Is Elastic Not Exciting?
Started by Shay Banon as a search engine for his wife's growing list of recipes at Le Cordon Bleu cooking school in Paris, Elastic (NYSE: ESTC) helps companies integrate search into their products and monitor their cloud infrastructure.
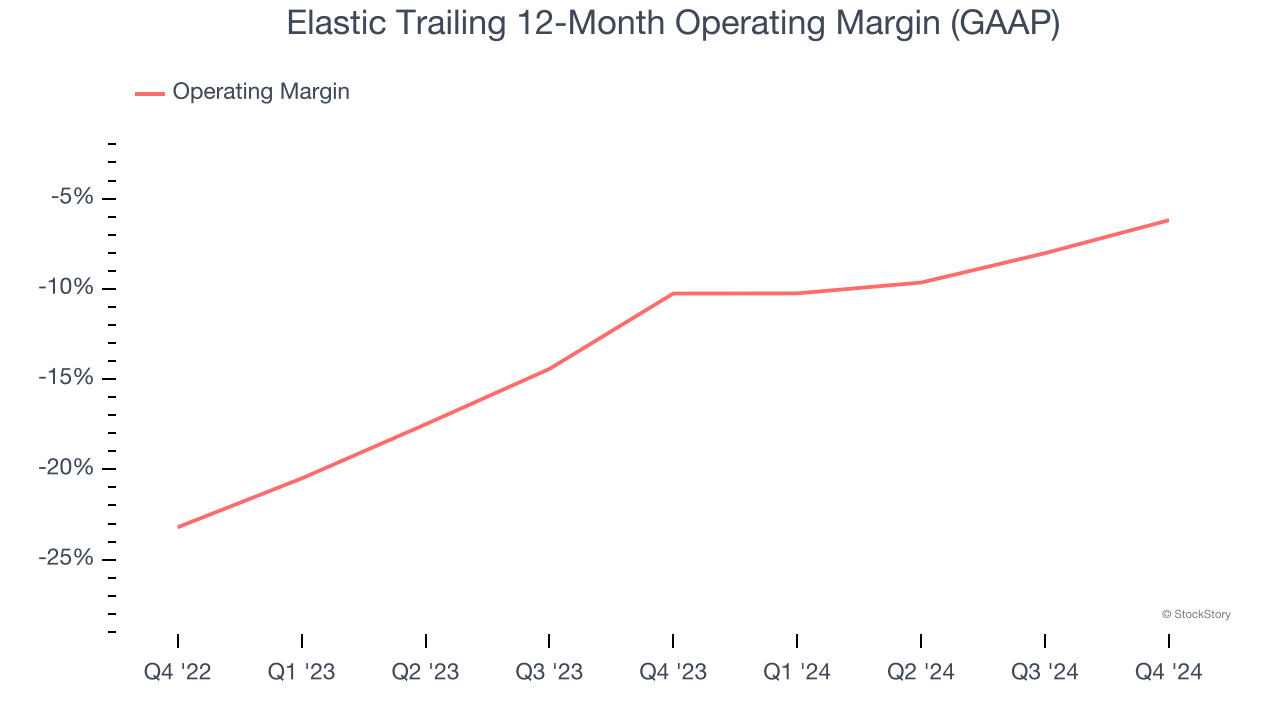
1. Operating Losses Sound the Alarms
Many software businesses adjust their profits for stock-based compensation (SBC), but we prioritize GAAP operating margin because SBC is a real expense used to attract and retain engineering and sales talent. This is one of the best measures of profitability because it shows how much money a company takes home after developing, marketing, and selling its products.
Elastic’s expensive cost structure has contributed to an average operating margin of negative 6.2% over the last year. Unprofitable, high-growth software companies require extra attention because they spend heaps of money to capture market share. As seen in its fast historical revenue growth, this strategy seems to have worked so far, but it’s unclear what would happen if Elastic reeled back its investments. Wall Street seems to be optimistic about its growth, but we have some doubts.
2. Cash Flow Margin Set to Decline
Free cash flow isn't a prominently featured metric in company financials and earnings releases, but we think it's telling because it accounts for all operating and capital expenses, making it tough to manipulate. Cash is king.
Over the next year, analysts predict Elastic’s cash conversion will fall. Their consensus estimates imply its free cash flow margin of 16.6% for the last 12 months will decrease to 14.8%.
Final Judgment
Elastic’s business quality ultimately falls short of our standards. Following its recent outperformance in a weaker market environment, the stock trades at 4.9× forward price-to-sales (or $77 per share). Investors with a higher risk tolerance might like the company, but we think the potential downside is too great. We're fairly confident there are better stocks to buy right now. Let us point you toward one of Charlie Munger’s all-time favorite businesses.
Stocks We Would Buy Instead of Elastic
The market surged in 2024 and reached record highs after Donald Trump’s presidential victory in November, but questions about new economic policies are adding much uncertainty for 2025.
While the crowd speculates what might happen next, we’re homing in on the companies that can succeed regardless of the political or macroeconomic environment. Put yourself in the driver’s seat and build a durable portfolio by checking out our Top 9 Market-Beating Stocks. This is a curated list of our High Quality stocks that have generated a market-beating return of 175% over the last five years.
Stocks that made our list in 2019 include now familiar names such as Nvidia (+2,183% between December 2019 and December 2024) as well as under-the-radar businesses like Sterling Infrastructure (+1,096% five-year return). Find your next big winner with StockStory today for free.


