Lincoln Educational currently trades at $17.36 and has been a dream stock for shareholders. It’s returned 594% since April 2020, blowing past the S&P 500’s 88.4% gain. The company has also beaten the index over the past six months as its stock price is up 32.1% thanks to its solid quarterly results.
Is there a buying opportunity in Lincoln Educational, or does it present a risk to your portfolio? Get the full stock story straight from our expert analysts, it’s free.
Why Is Lincoln Educational Not Exciting?
Despite the momentum, we don't have much confidence in Lincoln Educational. Here are three reasons why you should be careful with LINC and a stock we'd rather own.
1. Weak Growth in Enrolled Students Points to Soft Demand
Revenue growth can be broken down into changes in price and volume (for companies like Lincoln Educational, our preferred volume metric is enrolled students). While both are important, the latter is the most critical to analyze because prices have a ceiling.
Lincoln Educational’s enrolled students came in at 15,138 in the latest quarter, and over the last two years, averaged 7.2% year-on-year growth. This performance was underwhelming and suggests it might have to lower prices or invest in product improvements to accelerate growth, factors that can hinder near-term profitability. 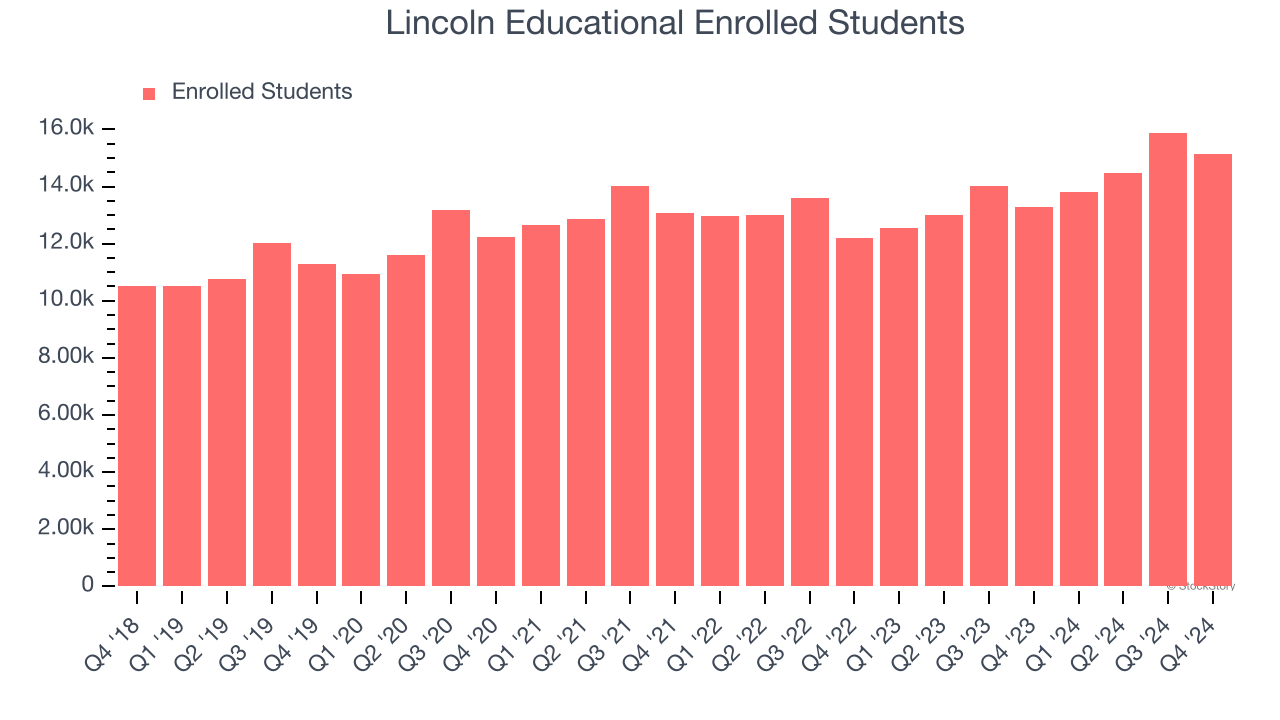
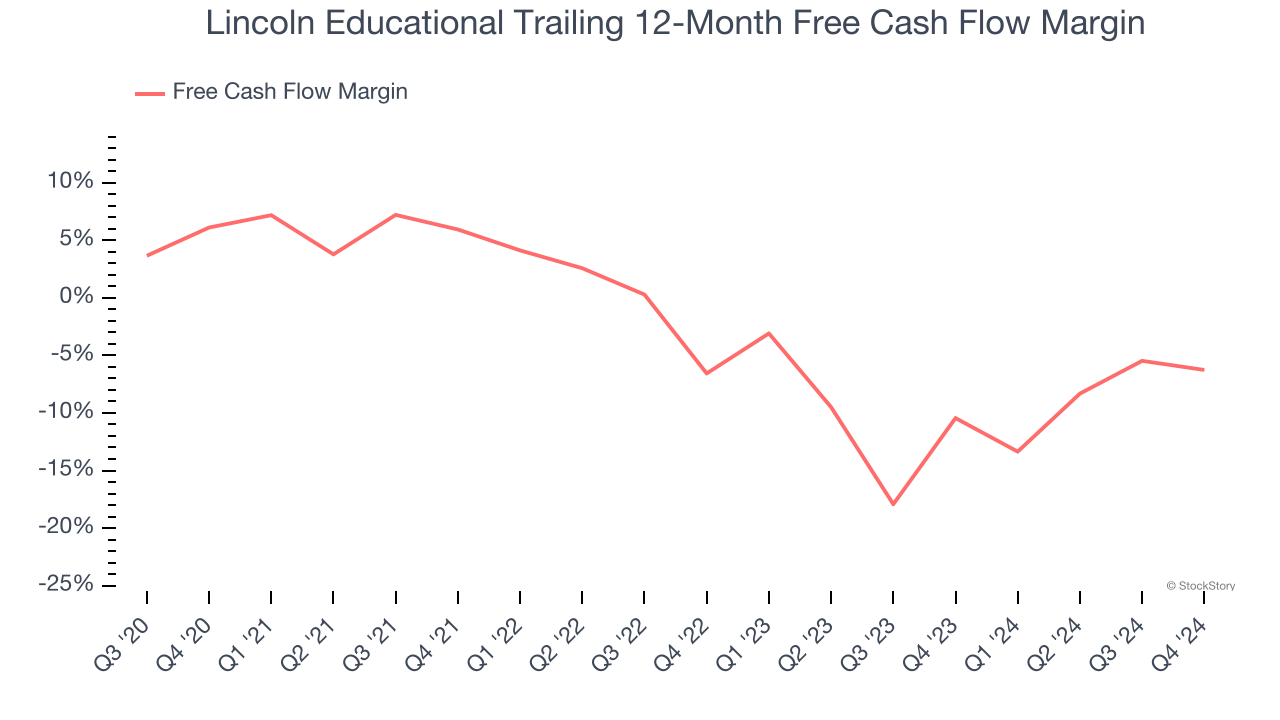
2. Cash Burn Ignites Concerns
Free cash flow isn't a prominently featured metric in company financials and earnings releases, but we think it's telling because it accounts for all operating and capital expenses, making it tough to manipulate. Cash is king.
While Lincoln Educational posted positive free cash flow this quarter, the broader story hasn’t been so clean. Over the last two years, Lincoln Educational’s demanding reinvestments to stay relevant have drained its resources, putting it in a pinch and limiting its ability to return capital to investors. Its free cash flow margin averaged negative 8.2%, meaning it lit $8.19 of cash on fire for every $100 in revenue.
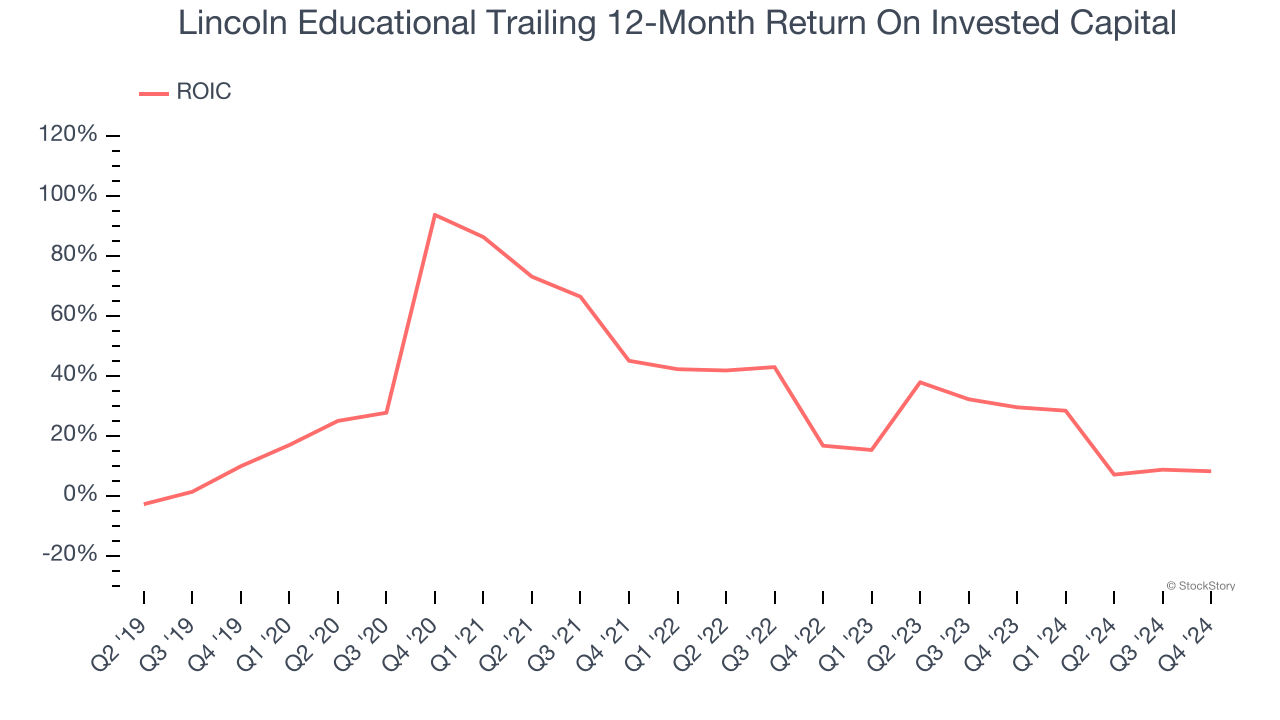
3. New Investments Fail to Bear Fruit as ROIC Declines
A company’s ROIC, or return on invested capital, shows how much operating profit it makes compared to the money it has raised (debt and equity).
We like to invest in businesses with high returns, but the trend in a company’s ROIC is what often surprises the market and moves the stock price. Over the last few years, Lincoln Educational’s ROIC has unfortunately decreased significantly. We like what management has done in the past, but its declining returns are perhaps a symptom of fewer profitable growth opportunities.
Final Judgment
Lincoln Educational isn’t a terrible business, but it isn’t one of our picks. With its shares topping the market in recent months, the stock trades at 10.3× forward EV-to-EBITDA (or $17.36 per share). This valuation tells us a lot of optimism is priced in - you can find better investment opportunities elsewhere. We’d recommend looking at a safe-and-steady industrials business benefiting from an upgrade cycle.
Stocks We Like More Than Lincoln Educational
The market surged in 2024 and reached record highs after Donald Trump’s presidential victory in November, but questions about new economic policies are adding much uncertainty for 2025.
While the crowd speculates what might happen next, we’re homing in on the companies that can succeed regardless of the political or macroeconomic environment. Put yourself in the driver’s seat and build a durable portfolio by checking out our Top 6 Stocks for this week. This is a curated list of our High Quality stocks that have generated a market-beating return of 175% over the last five years.
Stocks that made our list in 2019 include now familiar names such as Nvidia (+2,183% between December 2019 and December 2024) as well as under-the-radar businesses like Sterling Infrastructure (+1,096% five-year return). Find your next big winner with StockStory today for free.