
Social network Snapchat (NYSE: SNAP) announced better-than-expected revenue in Q1 CY2025, with sales up 14.1% year on year to $1.36 billion. Its GAAP loss of $0.08 per share was 40.3% above analysts’ consensus estimates.
Is now the time to buy Snap? Find out by accessing our full research report, it’s free.
Snap (SNAP) Q1 CY2025 Highlights:
- Revenue: $1.36 billion vs analyst estimates of $1.35 billion (14.1% year-on-year growth, 1.3% beat)
- EPS (GAAP): -$0.08 vs analyst estimates of -$0.13 (40.3% beat)
- Adjusted EBITDA: $108.4 million vs analyst estimates of $64.77 million (8% margin, 67.4% beat)
- Operating Margin: -14.2%, up from -27.9% in the same quarter last year
- Free Cash Flow Margin: 8.4%, down from 11.7% in the previous quarter
- Daily Active Users: 460 million, up 38 million year on year
- Market Capitalization: $14.98 billion
“We surpassed an important milestone in Q1, with our community growing to over 900 million monthly active users,” said Evan Spiegel, CEO.
Company Overview
Founded by Stanford University students Evan Spiegel, Reggie Brown, and Bobby Murphy, and originally called Picaboo, Snapchat (NYSE: SNAP) is an image centric social media network.
Sales Growth
A company’s long-term sales performance can indicate its overall quality. Any business can put up a good quarter or two, but many enduring ones grow for years. Unfortunately, Snap’s 7.8% annualized revenue growth over the last three years was tepid. This was below our standard for the consumer internet sector and is a poor baseline for our analysis.
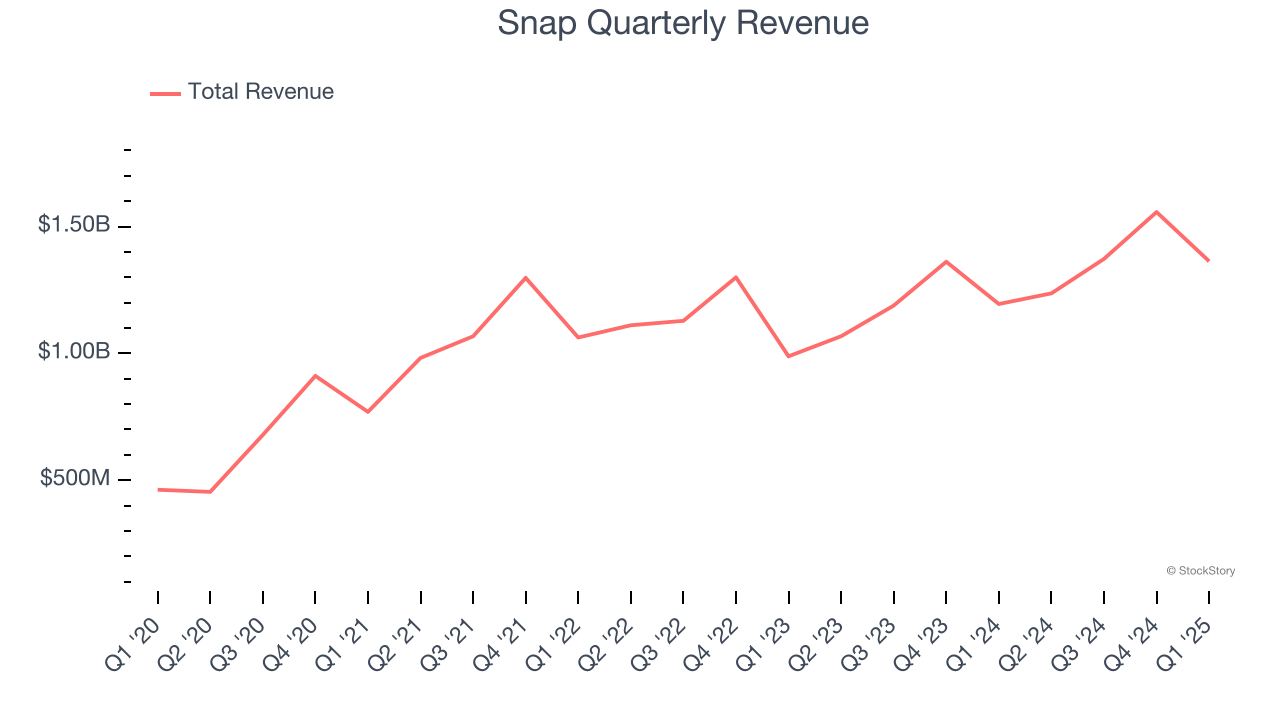
This quarter, Snap reported year-on-year revenue growth of 14.1%, and its $1.36 billion of revenue exceeded Wall Street’s estimates by 1.3%.
Looking ahead, sell-side analysts expect revenue to grow 10.6% over the next 12 months, an acceleration versus the last three years. This projection is above the sector average and implies its newer products and services will fuel better top-line performance.
Software is eating the world and there is virtually no industry left that has been untouched by it. That drives increasing demand for tools helping software developers do their jobs, whether it be monitoring critical cloud infrastructure, integrating audio and video functionality, or ensuring smooth content streaming. Click here to access a free report on our 3 favorite stocks to play this generational megatrend.
Daily Active Users
User Growth
As a social network, Snap generates revenue growth by increasing its user base and charging advertisers more for the ads each user is shown.
Over the last two years, Snap’s daily active users, a key performance metric for the company, increased by 10.4% annually to 460 million in the latest quarter. This growth rate is solid for a consumer internet business and indicates people are excited about its offerings. 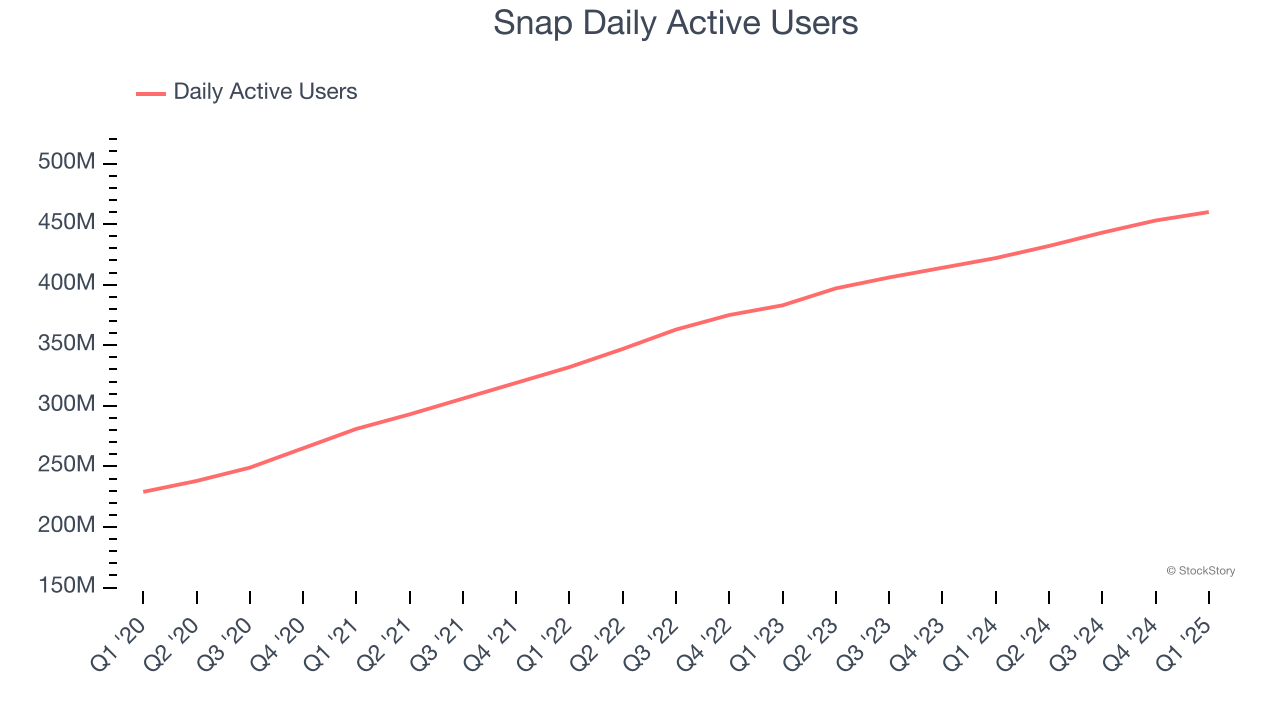
In Q1, Snap added 38 million daily active users, leading to 9% year-on-year growth. The quarterly print was lower than its two-year result, suggesting its new initiatives aren’t accelerating user growth just yet.
Revenue Per User
Average revenue per user (ARPU) is a critical metric to track because it measures how much the company earns from the ads shown to its users. ARPU can also be a proxy for how valuable advertisers find Snap’s audience and its ad-targeting capabilities.
Snap’s ARPU has been roughly flat over the last two years. This isn’t great, but the increase in daily active users is more relevant for assessing long-term business potential. We’ll monitor the situation closely; if Snap tries boosting ARPU by taking a more aggressive approach to monetization, it’s unclear whether users can continue growing at the current pace. 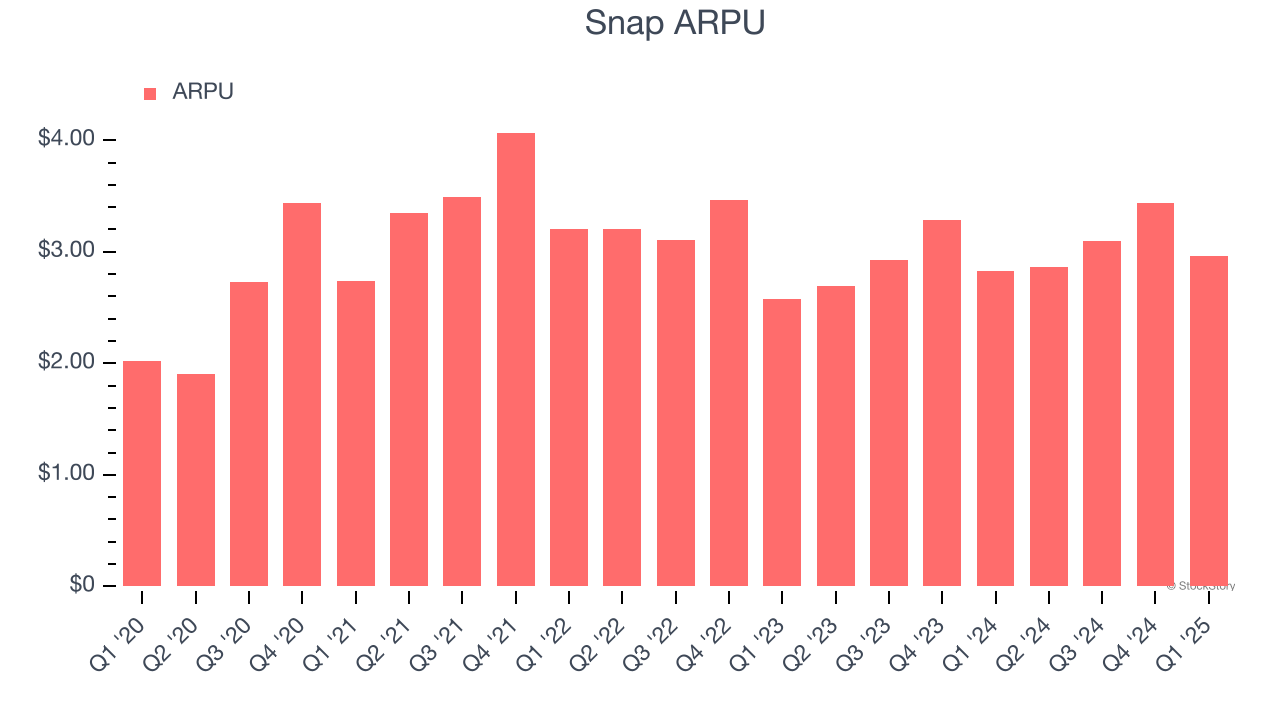
This quarter, Snap’s ARPU clocked in at $2.96. It grew by 4.7% year on year, slower than its user growth.
Key Takeaways from Snap’s Q1 Results
We were impressed by how significantly Snap blew past analysts’ EPS and EBITDA expectations this quarter. We were also happy its revenue narrowly outperformed Wall Street’s estimates. On the other hand, its free cash flow missed. Overall, we think this was a decent quarter with some key metrics above expectations. The market seemed to focus on the negatives, and the stock traded down 13.7% to $7.85 immediately following the results.
Is Snap an attractive investment opportunity at the current price? If you’re making that decision, you should consider the bigger picture of valuation, business qualities, as well as the latest earnings. We cover that in our actionable full research report which you can read here, it’s free.


