
ZoomInfo trades at $9.21 per share and has moved almost in lockstep with the market over the last six months. The stock has lost 5.2% while the S&P 500 is down 3.5%. This might have investors contemplating their next move.
Is there a buying opportunity in ZoomInfo, or does it present a risk to your portfolio? Get the full stock story straight from our expert analysts, it’s free.
Despite the more favorable entry price, we're sitting this one out for now. Here are three reasons why we avoid ZI and a stock we'd rather own.
Why Is ZoomInfo Not Exciting?
Founded in 2007 as DiscoveryOrg and renamed after a merger in 2019, ZoomInfo (NASDAQ: ZI) is a software as a service product that provides sales departments with access to a database of prospective clients.
1. Billings Hit a Plateau
Billings is a non-GAAP metric that is often called “cash revenue” because it shows how much money the company has collected from customers in a certain period. This is different from revenue, which must be recognized in pieces over the length of a contract.
Over the last year, ZoomInfo failed to grow its billings, which came in at $367.8 million in the latest quarter. This performance was underwhelming and shows the company faced challenges in acquiring and retaining customers. It also suggests there may be increasing competition or market saturation. 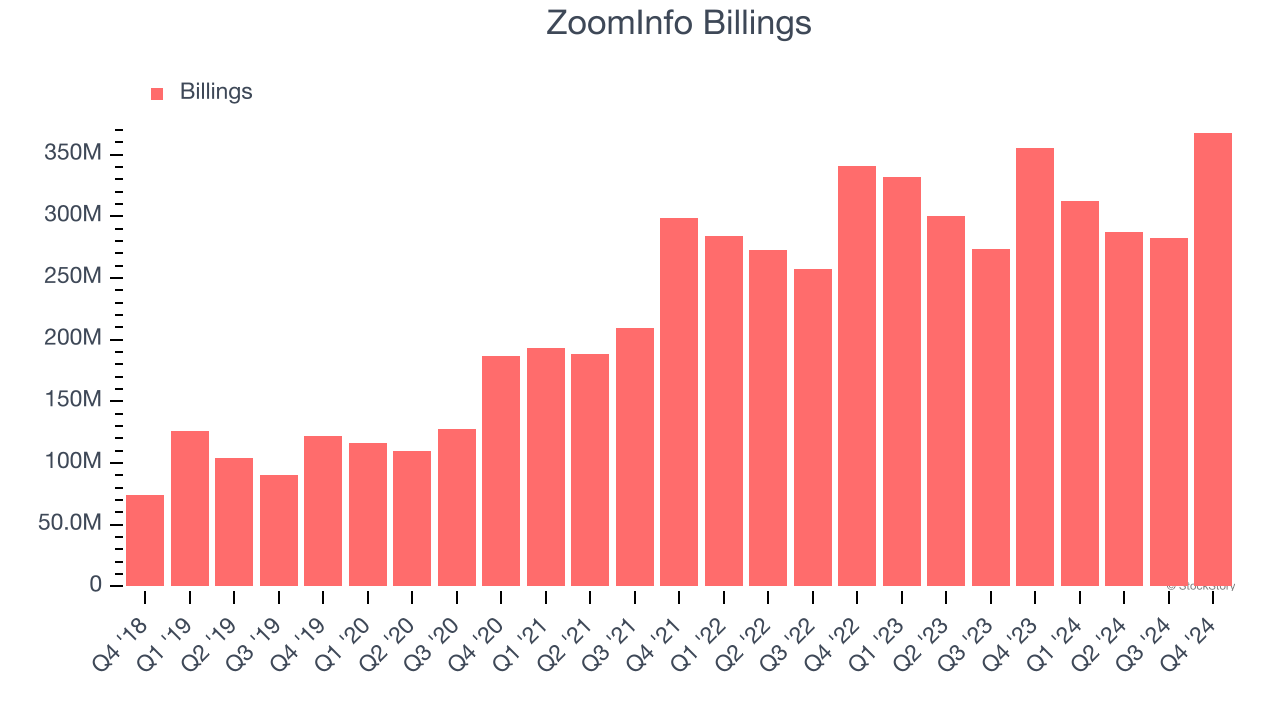
2. Customer Churn Hurts Long-Term Outlook
One of the best parts about the software-as-a-service business model (and a reason why they trade at high valuation multiples) is that customers typically spend more on a company’s products and services over time.
ZoomInfo’s net revenue retention rate, a key performance metric measuring how much money existing customers from a year ago are spending today, was 85.5% in Q4. This means ZoomInfo’s revenue would’ve decreased by 14.5% over the last 12 months if it didn’t win any new customers.
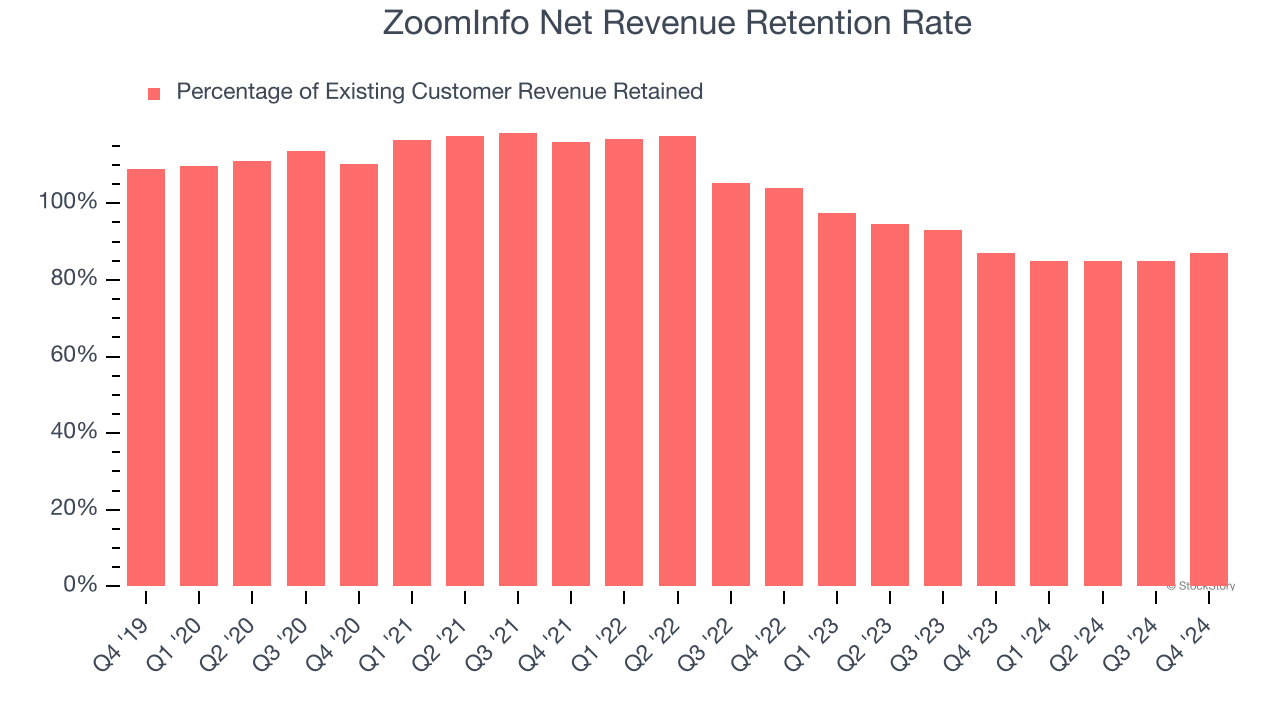
ZoomInfo has a poor net retention rate, warning us that its customers are churning and that its products might not live up to expectations.
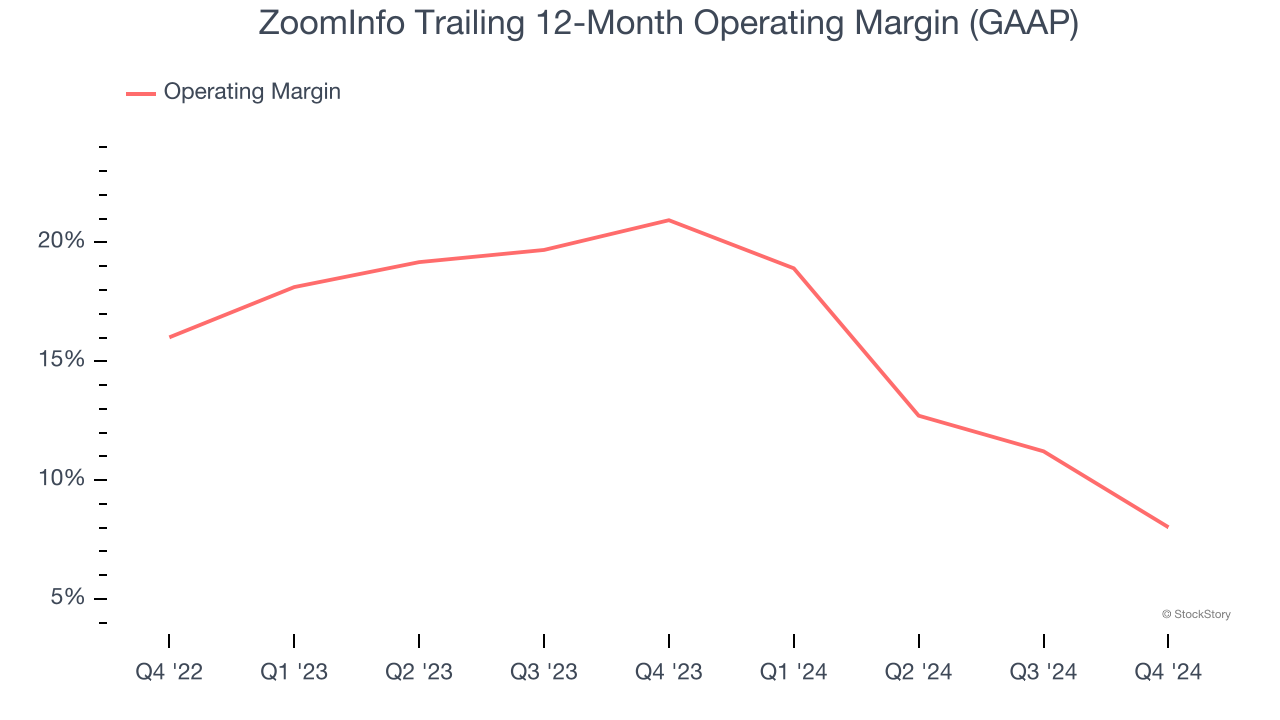
3. Shrinking Operating Margin
While many software businesses point investors to their adjusted profits, which exclude stock-based compensation (SBC), we prefer GAAP operating margin because SBC is a legitimate expense used to attract and retain talent. This is one of the best measures of profitability because it shows how much money a company takes home after developing, marketing, and selling its products.
Looking at the trend in its profitability, ZoomInfo’s operating margin decreased by 12.9 percentage points over the last year. This raises questions about the company’s expense base because its revenue growth should have given it leverage on its fixed costs, resulting in better economies of scale and profitability. Its operating margin for the trailing 12 months was 8%.
Final Judgment
ZoomInfo isn’t a terrible business, but it doesn’t pass our quality test. Following the recent decline, the stock trades at 3× forward price-to-sales (or $9.21 per share). Investors with a higher risk tolerance might like the company, but we don’t really see a big opportunity at the moment. We're pretty confident there are more exciting stocks to buy at the moment. We’d recommend looking at one of Charlie Munger’s all-time favorite businesses.
Stocks We Like More Than ZoomInfo
The market surged in 2024 and reached record highs after Donald Trump’s presidential victory in November, but questions about new economic policies are adding much uncertainty for 2025.
While the crowd speculates what might happen next, we’re homing in on the companies that can succeed regardless of the political or macroeconomic environment. Put yourself in the driver’s seat and build a durable portfolio by checking out our Top 5 Strong Momentum Stocks for this week. This is a curated list of our High Quality stocks that have generated a market-beating return of 175% over the last five years.
Stocks that made our list in 2019 include now familiar names such as Nvidia (+2,183% between December 2019 and December 2024) as well as under-the-radar businesses like Sterling Infrastructure (+1,096% five-year return). Find your next big winner with StockStory today for free.


