
Shareholders of Universal Display would probably like to forget the past six months even happened. The stock dropped 44.4% and now trades at $117.66. This was partly due to its softer quarterly results and might have investors contemplating their next move.
Following the pullback, is now a good time to buy OLED? Find out in our full research report, it’s free.
Why Does OLED Stock Spark Debate?
Serving major consumer electronics manufacturers, Universal Display (NASDAQ: OLED) is a provider of organic light emitting diode (OLED) technologies used in display and lighting applications.
Two Positive Attributes:
1. Elite Gross Margin Powers Best-In-Class Business Model
In the semiconductor industry, a company’s gross profit margin is a critical metric to track because it sheds light on its pricing power, complexity of products, and ability to procure raw materials, equipment, and labor.
Universal Display’s gross margin is one of the best in the semiconductor sector, and its strong pricing power is a direct result of its differentiated products and technological expertise. As you can see below, it averaged an elite 75.1% gross margin over the last two years. Said differently, roughly $75.12 was left to spend on selling, marketing, R&D, and general administrative overhead for every $100 in revenue. 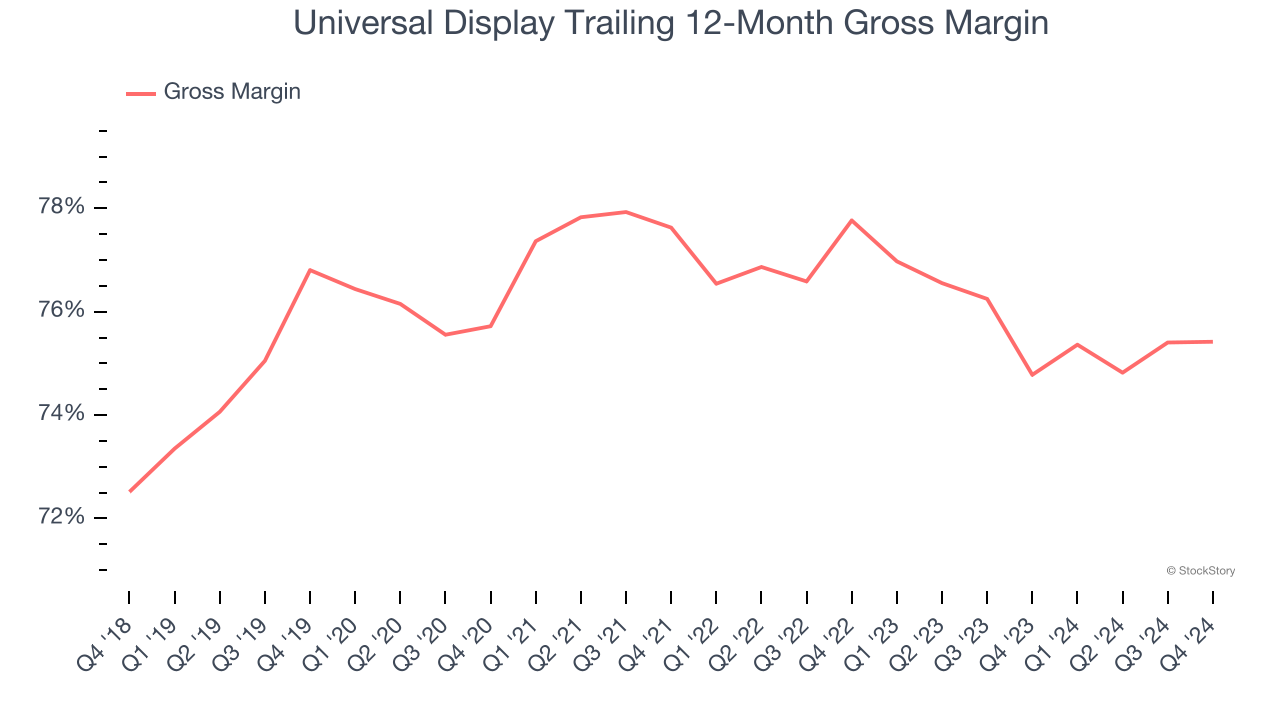
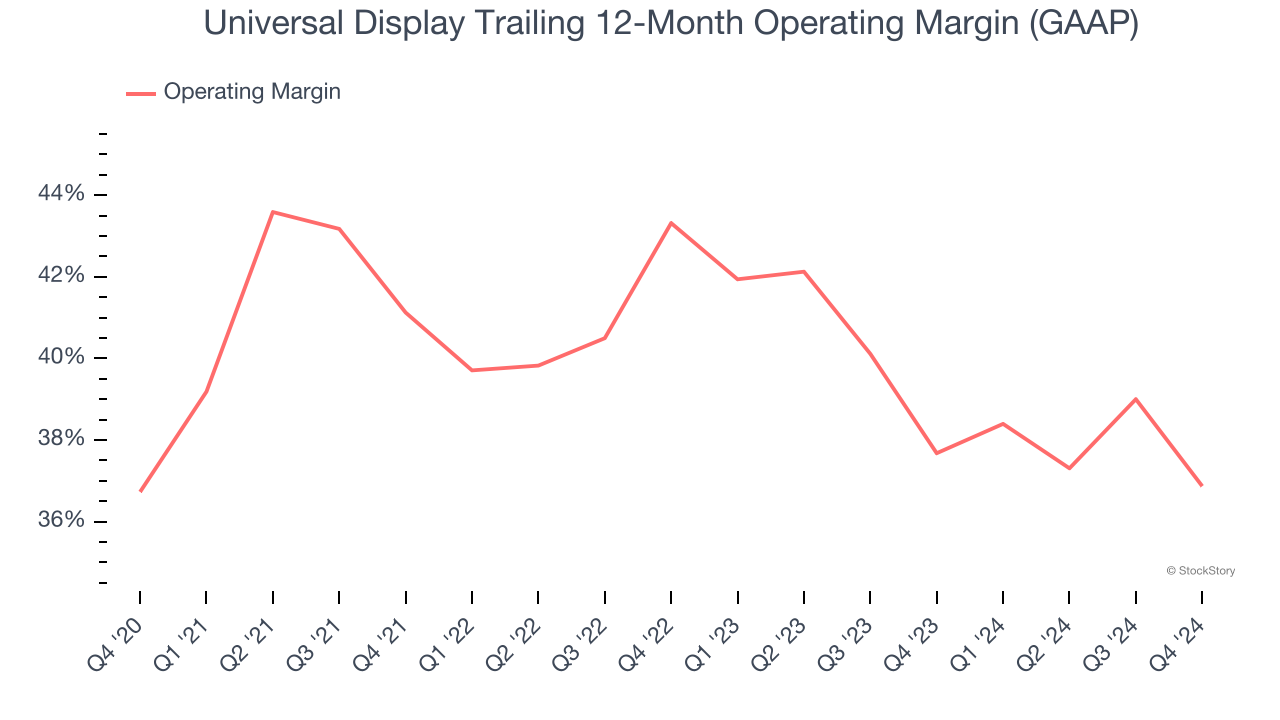
2. Operating Margin Reveals a Well-Run Organization
Operating margin is a key measure of profitability. Think of it as net income - the bottom line - excluding the impact of taxes and interest on debt, which are less connected to business fundamentals.
Universal Display has been a well-oiled machine over the last two years. It demonstrated elite profitability for a semiconductor business, boasting an average operating margin of 37.3%. This result isn’t surprising as its high gross margin gives it a favorable starting point.
One Reason to be Careful:
Projected Revenue Growth Is Slim
Forecasted revenues by Wall Street analysts signal a company’s potential. Predictions may not always be accurate, but accelerating growth typically boosts valuation multiples and stock prices while slowing growth does the opposite.
Over the next 12 months, sell-side analysts expect Universal Display’s revenue to rise by 3.2%, close to its 2.5% annualized growth for the past two years. This projection is underwhelming and indicates its newer products and services will not lead to better top-line performance yet. At least the company is tracking well in other measures of financial health.
Final Judgment
Universal Display has huge potential even though it has some open questions. After the recent drawdown, the stock trades at 22.7× forward price-to-earnings (or $117.66 per share). Is now a good time to buy? See for yourself in our full research report, it’s free.
Stocks We Like Even More Than Universal Display
Market indices reached historic highs following Donald Trump’s presidential victory in November 2024, but the outlook for 2025 is clouded by new trade policies that could impact business confidence and growth.
While this has caused many investors to adopt a "fearful" wait-and-see approach, we’re leaning into our best ideas that can grow regardless of the political or macroeconomic climate. Take advantage of Mr. Market by checking out our Top 5 Growth Stocks for this month. This is a curated list of our High Quality stocks that have generated a market-beating return of 175% over the last five years.
Stocks that made our list in 2019 include now familiar names such as Nvidia (+2,183% between December 2019 and December 2024) as well as under-the-radar businesses like Sterling Infrastructure (+1,096% five-year return). Find your next big winner with StockStory today for free.


