
Over the past six months, Dollar General has been a great trade. While the S&P 500 was flat, the stock price has climbed by 23.4% to $94.43 per share. This performance may have investors wondering how to approach the situation.
Is there a buying opportunity in Dollar General, or does it present a risk to your portfolio? Get the full stock story straight from our expert analysts, it’s free.
Why Is Dollar General Not Exciting?
We’re glad investors have benefited from the price increase, but we don't have much confidence in Dollar General. Here are three reasons why DG doesn't excite us and a stock we'd rather own.
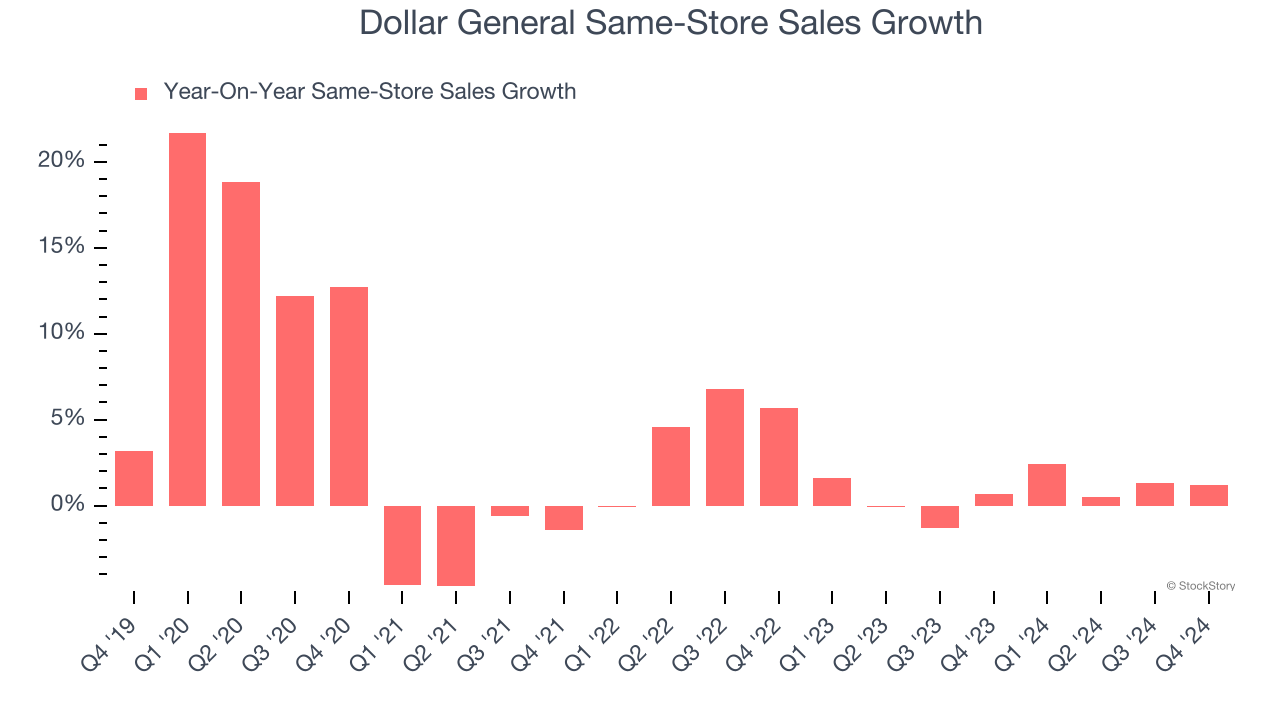
1. Flat Same-Store Sales Indicate Weak Demand
Same-store sales show the change in sales for a retailer's e-commerce platform and brick-and-mortar shops that have existed for at least a year. This is a key performance indicator because it measures organic growth.
Dollar General’s demand within its existing locations has barely increased over the last two years as its same-store sales were flat.
2. Low Gross Margin Reveals Weak Structural Profitability
At StockStory, we prefer high gross margin businesses because they indicate pricing power or differentiated products, giving the company a chance to generate higher operating profits.
Dollar General has bad unit economics for a retailer, signaling it operates in a competitive market and lacks pricing power because its inventory is sold in many places. As you can see below, it averaged a 29.9% gross margin over the last two years. Said differently, Dollar General had to pay a chunky $70.07 to its suppliers for every $100 in revenue. 
3. High Debt Levels Increase Risk
As long-term investors, the risk we care about most is the permanent loss of capital, which can happen when a company goes bankrupt or raises money from a disadvantaged position. This is separate from short-term stock price volatility, something we are much less bothered by.
Dollar General’s $17.46 billion of debt exceeds the $932.6 million of cash on its balance sheet. Furthermore, its 6× net-debt-to-EBITDA ratio (based on its EBITDA of $2.92 billion over the last 12 months) shows the company is overleveraged.
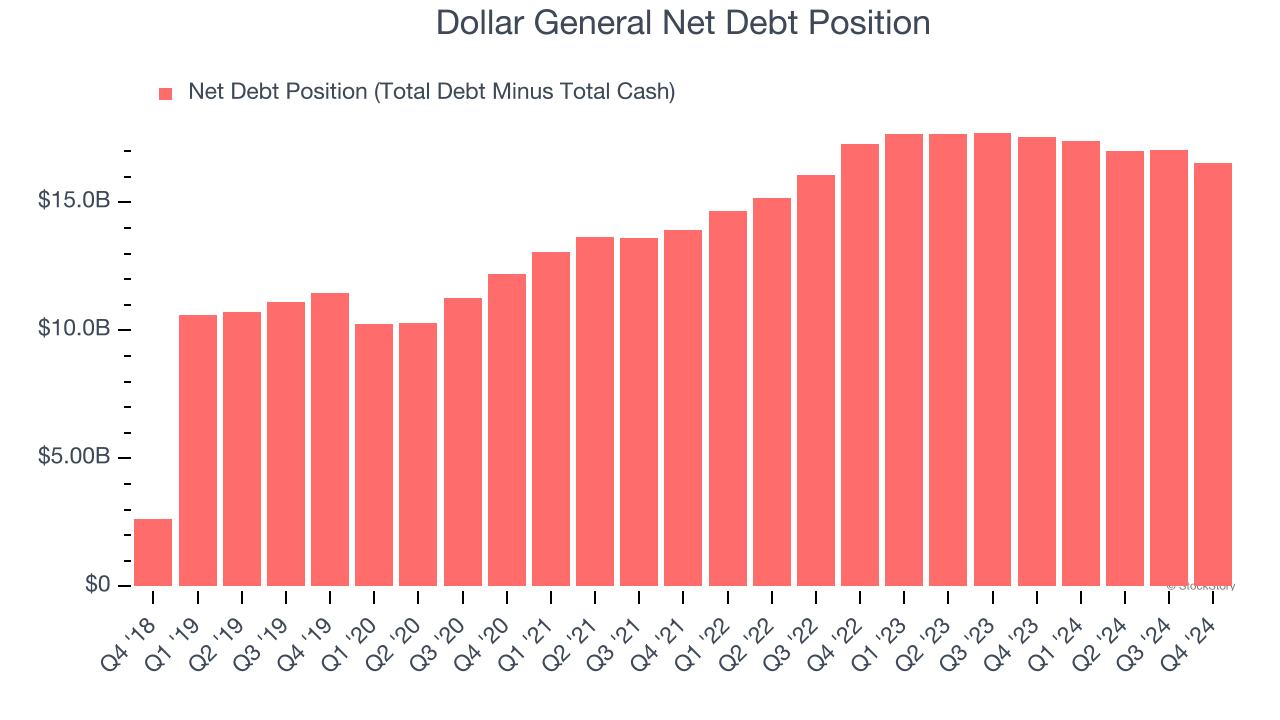
At this level of debt, incremental borrowing becomes increasingly expensive and credit agencies could downgrade the company’s rating if profitability falls. Dollar General could also be backed into a corner if the market turns unexpectedly – a situation we seek to avoid as investors in high-quality companies.
We hope Dollar General can improve its balance sheet and remain cautious until it increases its profitability or pays down its debt.
Final Judgment
Dollar General’s business quality ultimately falls short of our standards. With its shares beating the market recently, the stock trades at 15.9× forward P/E (or $94.43 per share). While this valuation is fair, the upside isn’t great compared to the potential downside. We're fairly confident there are better stocks to buy right now. Let us point you toward one of our top digital advertising picks.
High-Quality Stocks for All Market Conditions
Market indices reached historic highs following Donald Trump’s presidential victory in November 2024, but the outlook for 2025 is clouded by new trade policies that could impact business confidence and growth.
While this has caused many investors to adopt a "fearful" wait-and-see approach, we’re leaning into our best ideas that can grow regardless of the political or macroeconomic climate. Take advantage of Mr. Market by checking out our Top 5 Growth Stocks for this month. This is a curated list of our High Quality stocks that have generated a market-beating return of 176% over the last five years.
Stocks that made our list in 2020 include now familiar names such as Nvidia (+1,545% between March 2020 and March 2025) as well as under-the-radar businesses like the once-small-cap company Exlservice (+354% five-year return). Find your next big winner with StockStory today.


