Micron currently trades at $97.70 per share and has shown little upside over the past six months, posting a small loss of 4.9%.
Is now the time to buy Micron, or should you be careful about including it in your portfolio? Get the full stock story straight from our expert analysts, it’s free.
Why Is Micron Not Exciting?
We're cautious about Micron. Here are three reasons why there are better opportunities than MU and a stock we'd rather own.
1. Low Gross Margin Reveals Weak Structural Profitability
Gross profit margin is a key metric to track because it shows how much money a semiconductor company gets to keep after paying for its raw materials, manufacturing, and other input costs.
Micron’s gross margin is one of the worst in the semiconductor industry, signaling it operates in a competitive market and lacks pricing power. As you can see below, it averaged a 21.8% gross margin over the last two years. Said differently, Micron had to pay a chunky $78.20 to its suppliers for every $100 in revenue. 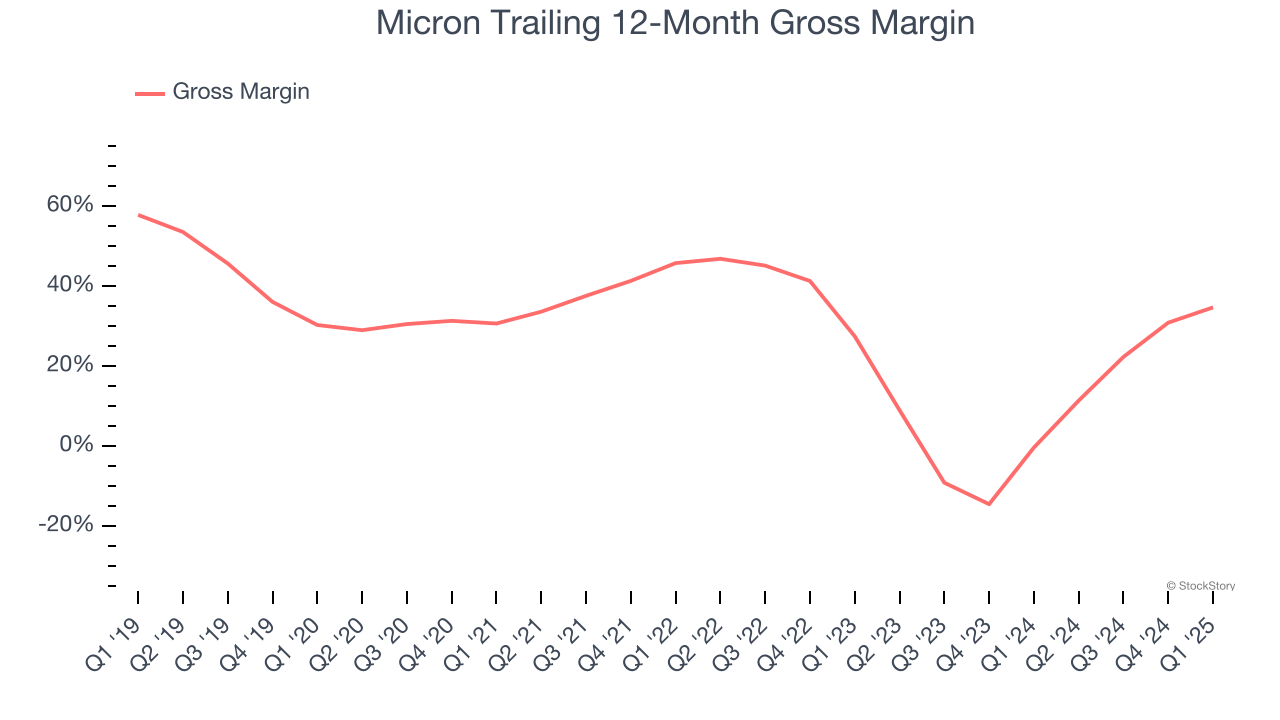
2. Weak Operating Margin Could Cause Trouble
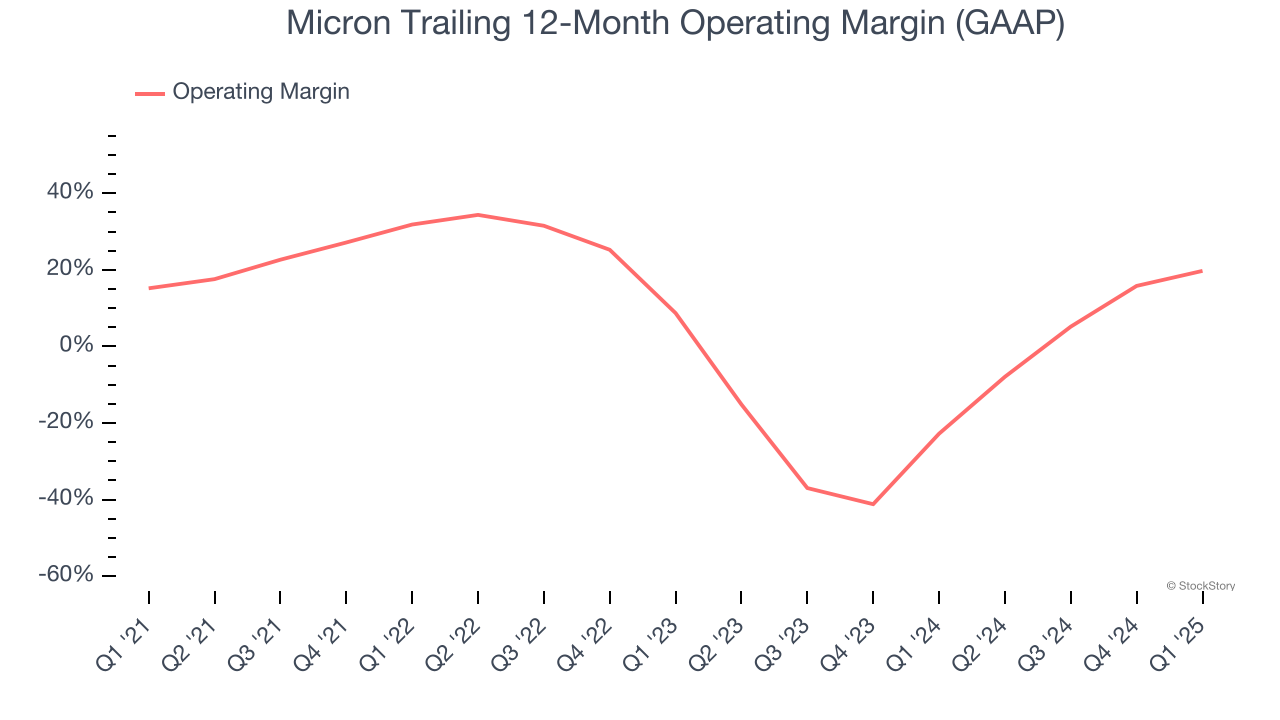
Operating margin is one of the best measures of profitability because it tells us how much money a company takes home after procuring and manufacturing its products, marketing and selling those products, and most importantly, keeping them relevant through research and development.
Micron was profitable over the last two years but held back by its large cost base. Its average operating margin of 4.1% was among the worst in the semiconductor sector. This result isn’t too surprising given its low gross margin as a starting point.
3. Cash Burn Ignites Concerns
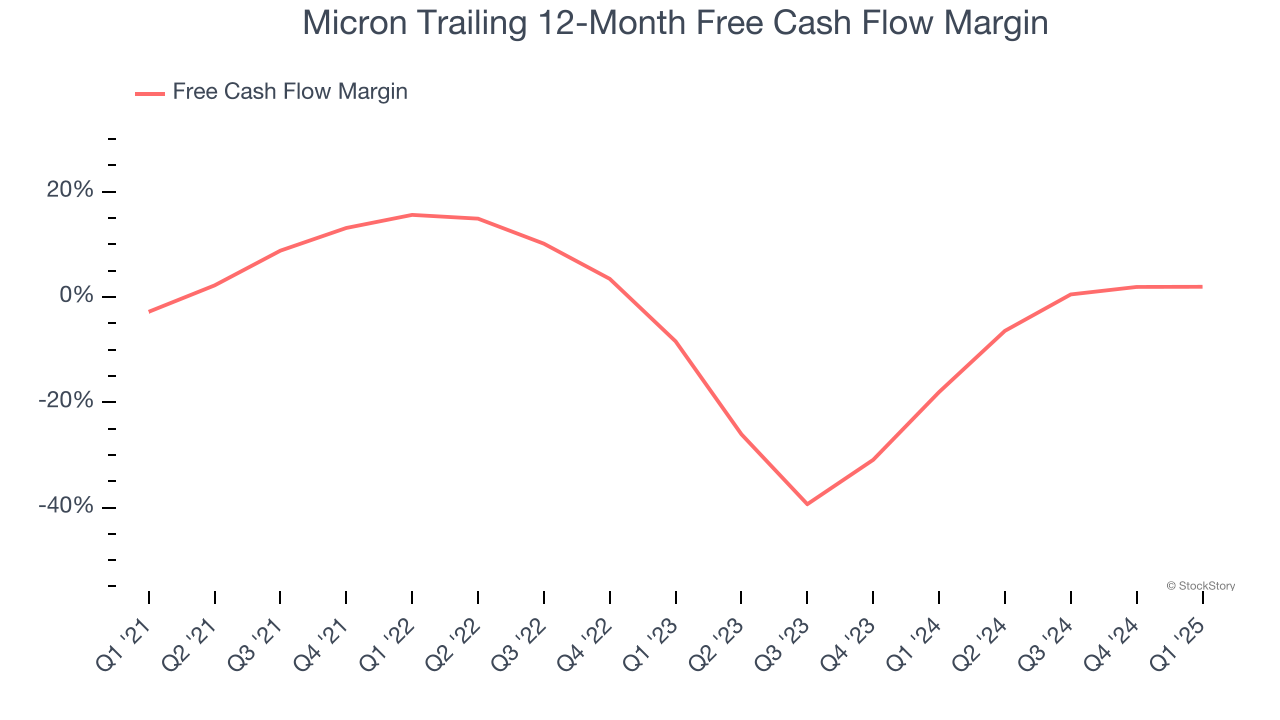
If you’ve followed StockStory for a while, you know we emphasize free cash flow. Why, you ask? We believe that in the end, cash is king, and you can’t use accounting profits to pay the bills.
Micron’s demanding reinvestments have drained its resources over the last two years, putting it in a pinch and limiting its ability to return capital to investors. Its free cash flow margin averaged negative 5.4%, meaning it lit $5.45 of cash on fire for every $100 in revenue.
Final Judgment
Micron isn’t a terrible business, but it doesn’t pass our quality test. That said, the stock currently trades at 11.2× forward P/E (or $97.70 per share). This valuation multiple is fair, but we don’t have much faith in the company. We're fairly confident there are better investments elsewhere. We’d suggest looking at a fast-growing restaurant franchise with an A+ ranch dressing sauce.
Stocks We Would Buy Instead of Micron
The market surged in 2024 and reached record highs after Donald Trump’s presidential victory in November, but questions about new economic policies are adding much uncertainty for 2025.
While the crowd speculates what might happen next, we’re homing in on the companies that can succeed regardless of the political or macroeconomic environment. Put yourself in the driver’s seat and build a durable portfolio by checking out our Top 9 Market-Beating Stocks. This is a curated list of our High Quality stocks that have generated a market-beating return of 176% over the last five years.
Stocks that made our list in 2020 include now familiar names such as Nvidia (+1,545% between March 2020 and March 2025) as well as under-the-radar businesses like the once-micro-cap company Kadant (+351% five-year return). Find your next big winner with StockStory today.