
Industrial products company CSW (NASDAQ: CSWI) fell short of the market’s revenue expectations in Q1 CY2025, but sales rose 9.3% year on year to $230.5 million. Its non-GAAP profit of $2.24 per share was 1.1% above analysts’ consensus estimates.
Is now the time to buy CSW? Find out by accessing our full research report, it’s free.
CSW (CSWI) Q1 CY2025 Highlights:
- Revenue: $230.5 million vs analyst estimates of $232.8 million (9.3% year-on-year growth, 1% miss)
- Adjusted EPS: $2.24 vs analyst estimates of $2.22 (1.1% beat)
- Adjusted EBITDA: $59.76 million vs analyst estimates of $60.37 million (25.9% margin, 1% miss)
- Operating Margin: 19.5%, down from 22% in the same quarter last year
- Free Cash Flow Margin: 9.9%, up from 8.3% in the same quarter last year
- Market Capitalization: $5.28 billion
"Total revenue increased 10.8% to $878.3 million, of which $47.5 million, or 6.0%, was inorganic growth from recent acquisitions, and 4.8%, or $37.9 million was organic growth. Contractor Solutions delivered organic revenue growth of 6.2% during the fiscal full year. Net income attributable to CSWI of $136.7 million, or $137.2 million adjusted, increased 25.7% as compared to $109.1 million. EPS of $8.38, or $8.41 adjusted, improved 20.0% compared to $7.01. Adjusted EBITDA increased 13.9% to $227.9 million, including margin expansion of 70 bps to 25.9%. Invested $84.7 million in acquisitions of PSP Products and PF Waterworks and $16.3 million in organic capital expenditures, while returning total cash of $32.9 million to shareholders through share repurchases of $18.3 million and dividends of $14.6 million. Subsequent to fiscal year-end, announced transfer of listing of common stock to the New York Stock Exchange beginning June 9, 2025, and change in ticker symbol to CSW" Comments from the Chairman, President, and Chief Executive Officer
Company Overview
With over two centuries of combined operations manufacturing and supplying, CSW (NASDAQ: CSWI) offers special chemicals, coatings, sealants, and lubricants for various industries.
Sales Growth
A company’s long-term sales performance can indicate its overall quality. Any business can put up a good quarter or two, but many enduring ones grow for years. Over the last five years, CSW grew its sales at an incredible 17.9% compounded annual growth rate. Its growth surpassed the average industrials company and shows its offerings resonate with customers, a great starting point for our analysis.
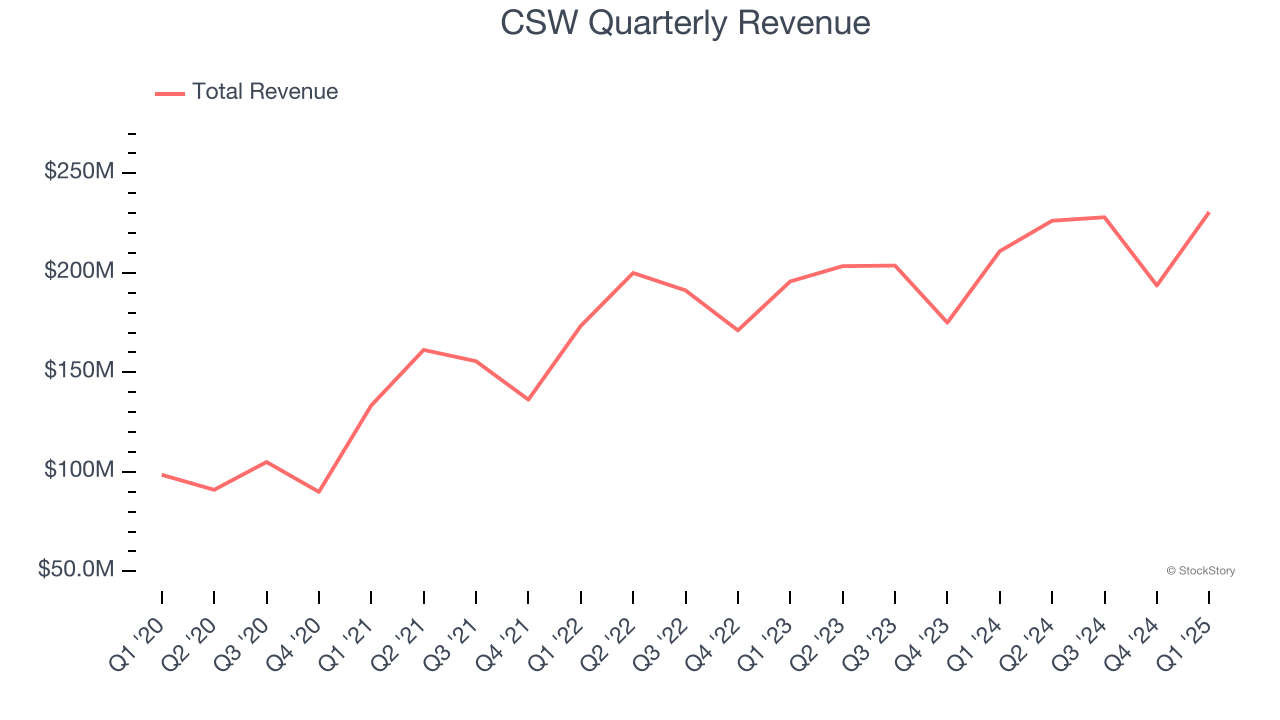
We at StockStory place the most emphasis on long-term growth, but within industrials, a half-decade historical view may miss cycles, industry trends, or a company capitalizing on catalysts such as a new contract win or a successful product line. CSW’s annualized revenue growth of 7.7% over the last two years is below its five-year trend, but we still think the results were respectable. 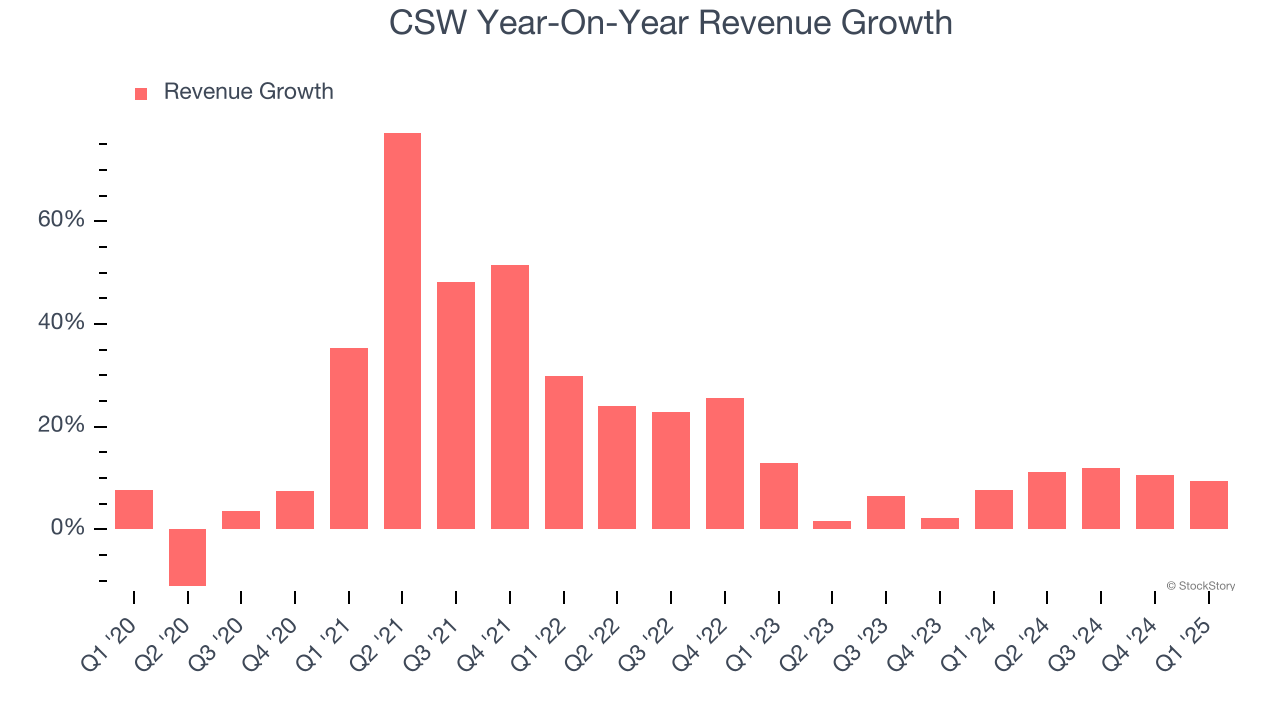
This quarter, CSW’s revenue grew by 9.3% year on year to $230.5 million, missing Wall Street’s estimates.
Looking ahead, sell-side analysts expect revenue to grow 12.6% over the next 12 months, an improvement versus the last two years. This projection is noteworthy and indicates its newer products and services will spur better top-line performance.
Here at StockStory, we certainly understand the potential of thematic investing. Diverse winners from Microsoft (MSFT) to Alphabet (GOOG), Coca-Cola (KO) to Monster Beverage (MNST) could all have been identified as promising growth stories with a megatrend driving the growth. So, in that spirit, we’ve identified a relatively under-the-radar profitable growth stock benefiting from the rise of AI, available to you FREE via this link.
Operating Margin
Operating margin is one of the best measures of profitability because it tells us how much money a company takes home after procuring and manufacturing its products, marketing and selling those products, and most importantly, keeping them relevant through research and development.
CSW has been a well-oiled machine over the last five years. It demonstrated elite profitability for an industrials business, boasting an average operating margin of 18.7%. This result isn’t surprising as its high gross margin gives it a favorable starting point.
Analyzing the trend in its profitability, CSW’s operating margin rose by 3.9 percentage points over the last five years, as its sales growth gave it operating leverage.
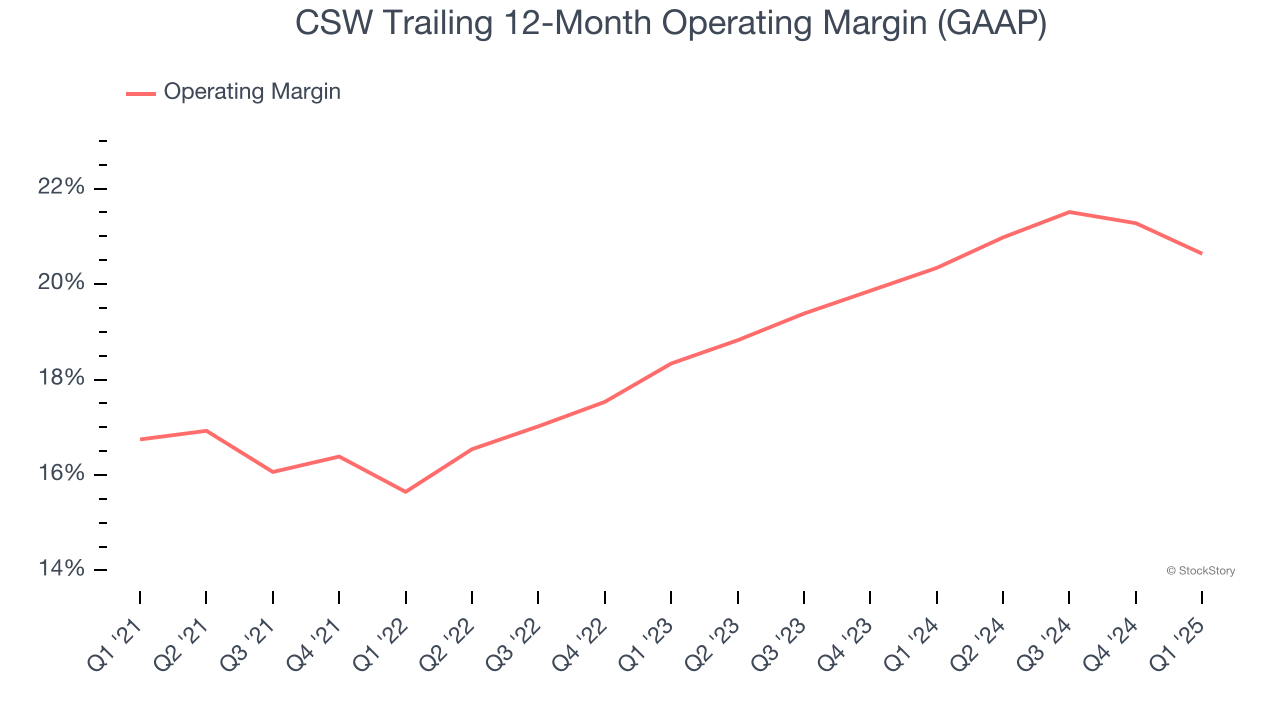
In Q1, CSW generated an operating profit margin of 19.5%, down 2.5 percentage points year on year. Since CSW’s operating margin decreased more than its gross margin, we can assume it was less efficient because expenses such as marketing, R&D, and administrative overhead increased.
Earnings Per Share
Revenue trends explain a company’s historical growth, but the long-term change in earnings per share (EPS) points to the profitability of that growth – for example, a company could inflate its sales through excessive spending on advertising and promotions.
CSW’s EPS grew at an astounding 24.5% compounded annual growth rate over the last five years, higher than its 17.9% annualized revenue growth. This tells us the company became more profitable on a per-share basis as it expanded.
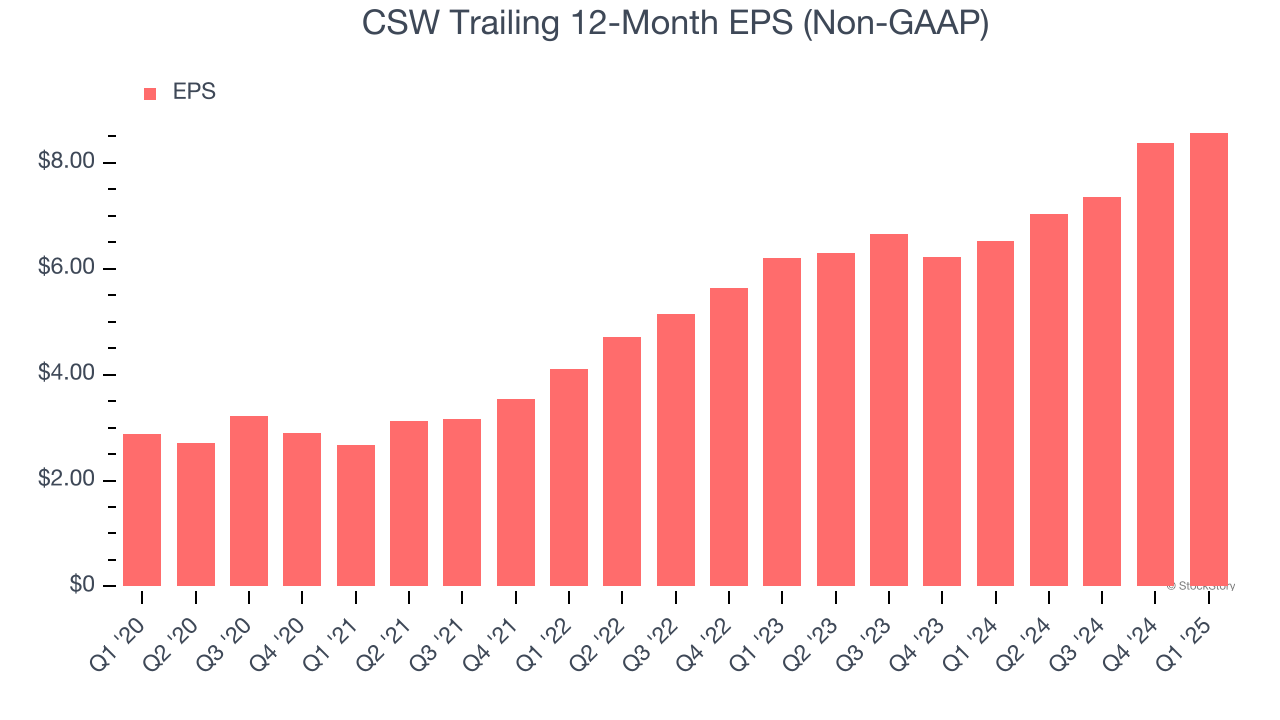
We can take a deeper look into CSW’s earnings to better understand the drivers of its performance. As we mentioned earlier, CSW’s operating margin declined this quarter but expanded by 3.9 percentage points over the last five years. This was the most relevant factor (aside from the revenue impact) behind its higher earnings; taxes and interest expenses can also affect EPS but don’t tell us as much about a company’s fundamentals.
Like with revenue, we analyze EPS over a more recent period because it can provide insight into an emerging theme or development for the business.
For CSW, its two-year annual EPS growth of 17.6% was lower than its five-year trend. We still think its growth was good and hope it can accelerate in the future.
In Q1, CSW reported EPS at $2.24, up from $2.04 in the same quarter last year. This print beat analysts’ estimates by 1.1%. Over the next 12 months, Wall Street expects CSW’s full-year EPS of $8.57 to grow 11%.
Key Takeaways from CSW’s Q1 Results
Revenue missed slightly, but EPS beat slightly. Overall, we'd call this quarter fairly online, neither great nor terrible. The stock remained flat at $312.45 immediately following the results.
CSW’s earnings report left more to be desired. Let’s look forward to see if this quarter has created an opportunity to buy the stock. What happened in the latest quarter matters, but not as much as longer-term business quality and valuation, when deciding whether to invest in this stock. We cover that in our actionable full research report which you can read here, it’s free.


