
Over the last six months, MDU Resources shares have sunk to $17.13, producing a disappointing 14.1% loss - worse than the S&P 500’s 2.1% drop. This may have investors wondering how to approach the situation.
Is there a buying opportunity in MDU Resources, or does it present a risk to your portfolio? Get the full stock story straight from our expert analysts, it’s free.
Why Do We Think MDU Resources Will Underperform?
Even though the stock has become cheaper, we're sitting this one out for now. Here are three reasons why there are better opportunities than MDU and a stock we'd rather own.
1. Revenue Spiraling Downwards
A company’s long-term performance is an indicator of its overall quality. Any business can experience short-term success, but top-performing ones enjoy sustained growth for years. MDU Resources struggled to consistently generate demand over the last five years as its sales dropped at a 25.9% annual rate. This was below our standards and signals it’s a low quality business. 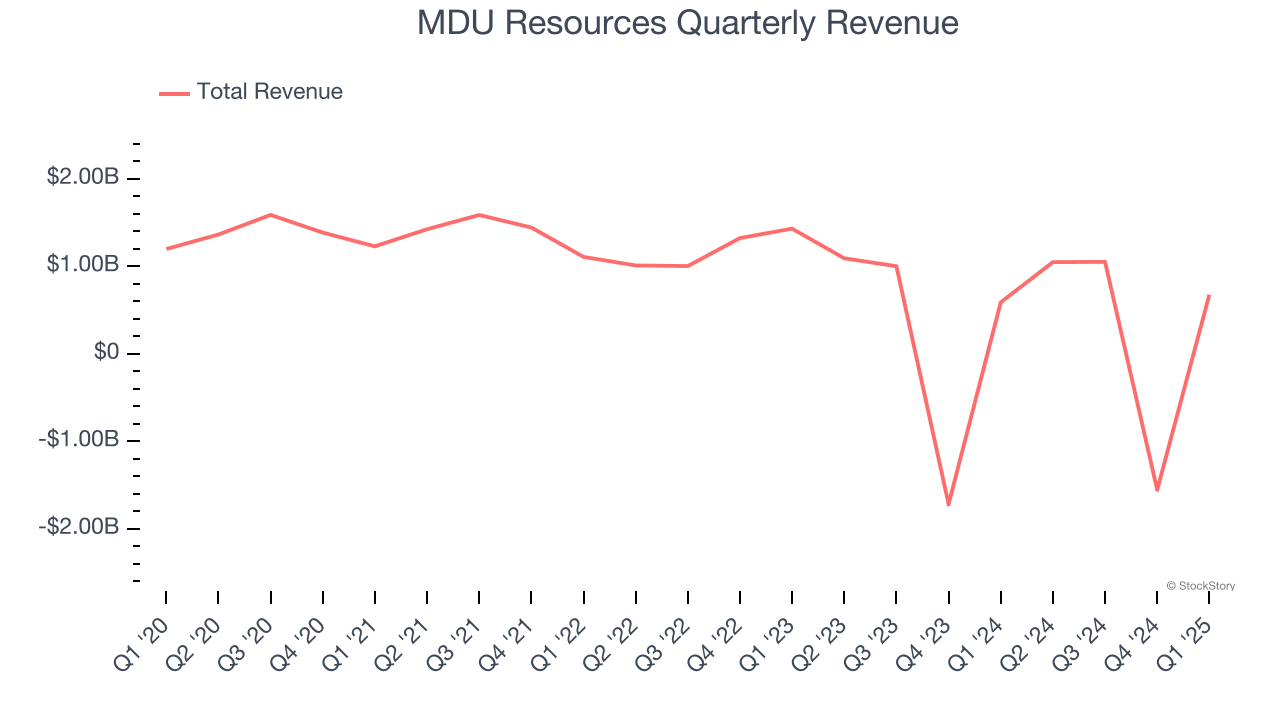
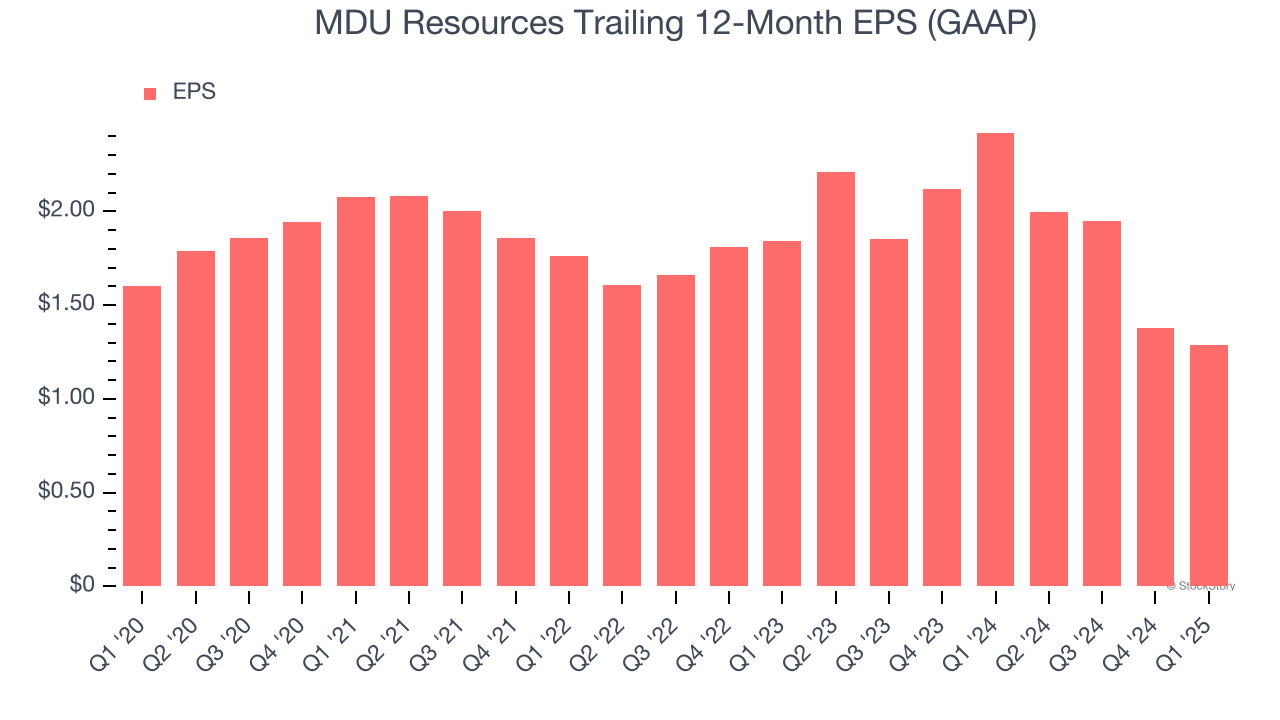
2. EPS Trending Down
We track the long-term change in earnings per share (EPS) because it highlights whether a company’s growth is profitable.
Sadly for MDU Resources, its EPS and revenue declined by 4.3% and 25.9% annually over the last five years. We tend to steer our readers away from companies with falling revenue and EPS, where diminishing earnings could imply changing secular trends and preferences. If the tide turns unexpectedly, MDU Resources’s low margin of safety could leave its stock price susceptible to large downswings.
3. High Debt Levels Increase Risk
As long-term investors, the risk we care about most is the permanent loss of capital, which can happen when a company goes bankrupt or raises money from a disadvantaged position. This is separate from short-term stock price volatility, something we are much less bothered by.
MDU Resources’s $2.03 billion of debt exceeds the $59.54 million of cash on its balance sheet. Furthermore, its 5× net-debt-to-EBITDA ratio (based on its EBITDA of $380.6 million over the last 12 months) shows the company is overleveraged.
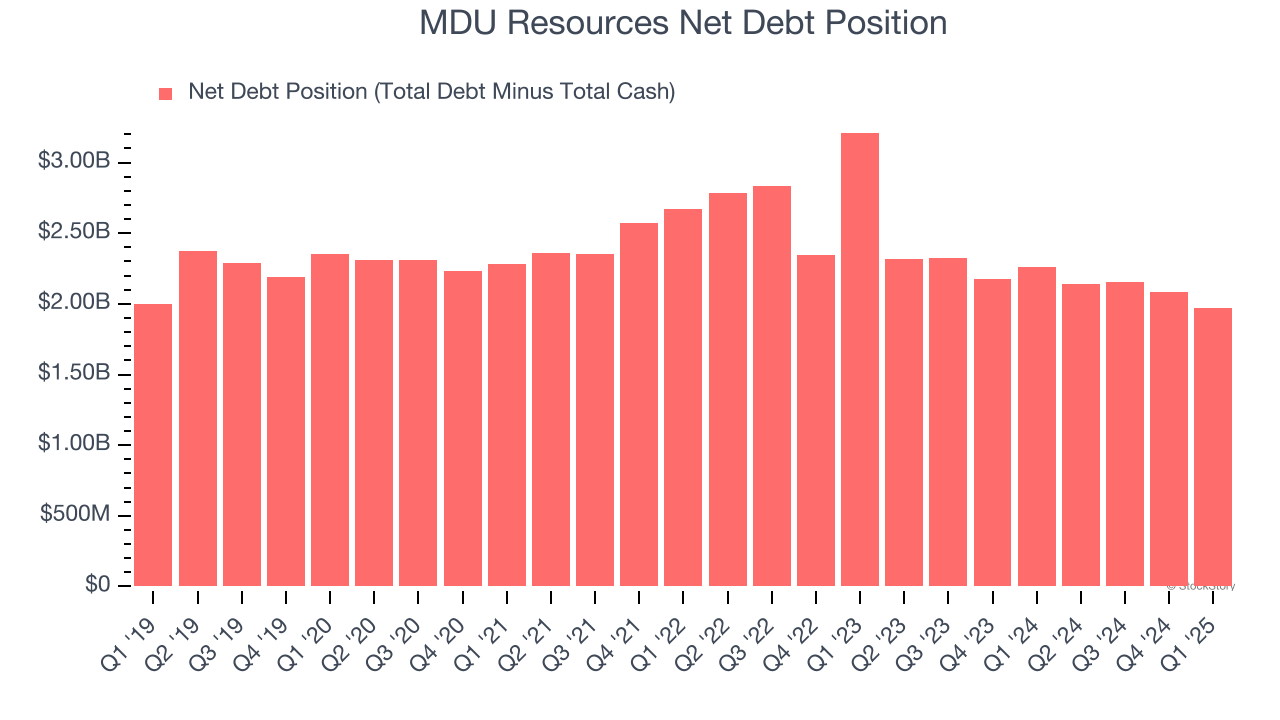
At this level of debt, incremental borrowing becomes increasingly expensive and credit agencies could downgrade the company’s rating if profitability falls. MDU Resources could also be backed into a corner if the market turns unexpectedly – a situation we seek to avoid as investors in high-quality companies.
We hope MDU Resources can improve its balance sheet and remain cautious until it increases its profitability or pays down its debt.
Final Judgment
MDU Resources doesn’t pass our quality test. Following the recent decline, the stock trades at 16.7× forward P/E (or $17.13 per share). This multiple tells us a lot of good news is priced in - we think there are better investment opportunities out there. We’d recommend looking at one of our top software and edge computing picks.
Stocks We Would Buy Instead of MDU Resources
The market surged in 2024 and reached record highs after Donald Trump’s presidential victory in November, but questions about new economic policies are adding much uncertainty for 2025.
While the crowd speculates what might happen next, we’re homing in on the companies that can succeed regardless of the political or macroeconomic environment. Put yourself in the driver’s seat and build a durable portfolio by checking out our Top 6 Stocks for this week. This is a curated list of our High Quality stocks that have generated a market-beating return of 176% over the last five years.
Stocks that made our list in 2020 include now familiar names such as Nvidia (+1,545% between March 2020 and March 2025) as well as under-the-radar businesses like the once-micro-cap company Tecnoglass (+1,754% five-year return). Find your next big winner with StockStory today.


