
MarineMax has gotten torched over the last six months - since November 2024, its stock price has dropped 35.6% to $21.51 per share. This might have investors contemplating their next move.
Is there a buying opportunity in MarineMax, or does it present a risk to your portfolio? Check out our in-depth research report to see what our analysts have to say, it’s free.
Why Is MarineMax Not Exciting?
Even with the cheaper entry price, we're sitting this one out for now. Here are three reasons why HZO doesn't excite us and a stock we'd rather own.
1. Stores Are Closing, a Headwind for Revenue
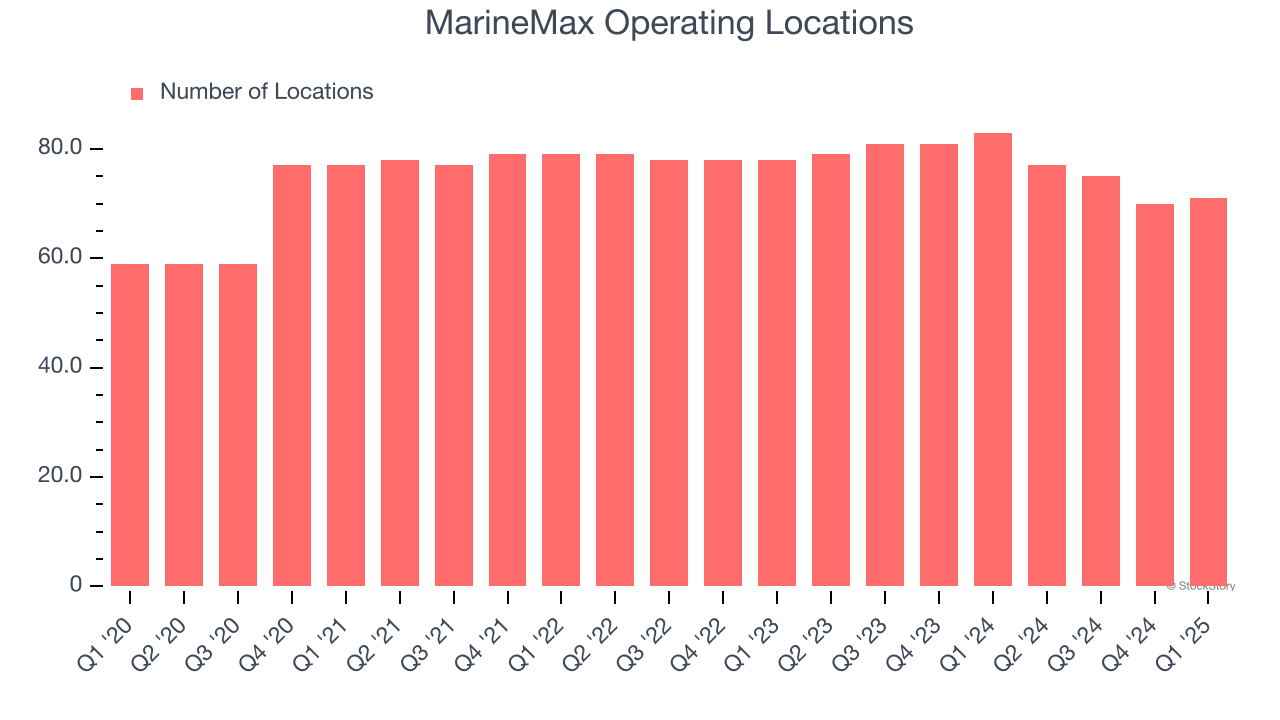
A retailer’s store count influences how much it can sell and how quickly revenue can grow.
MarineMax operated 71 locations in the latest quarter. Over the last two years, the company has generally closed its stores, averaging 3% annual declines.
When a retailer shutters stores, it usually means that brick-and-mortar demand is less than supply, and it is responding by closing underperforming locations to improve profitability.
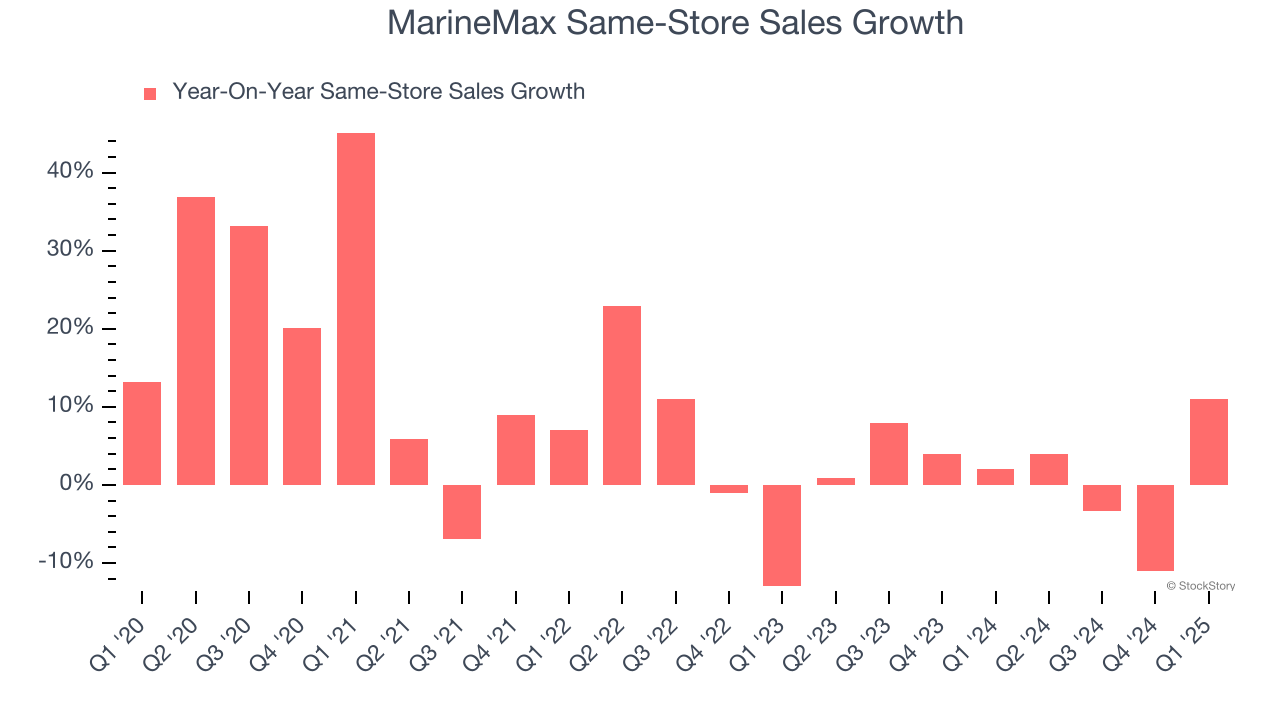
2. Same-Store Sales Falling Behind Peers
Same-store sales show the change in sales for a retailer's e-commerce platform and brick-and-mortar shops that have existed for at least a year. This is a key performance indicator because it measures organic growth.
MarineMax’s demand within its existing locations has been relatively stable over the last two years but was below most retailers. On average, the company’s same-store sales have grown by 1.9% per year.
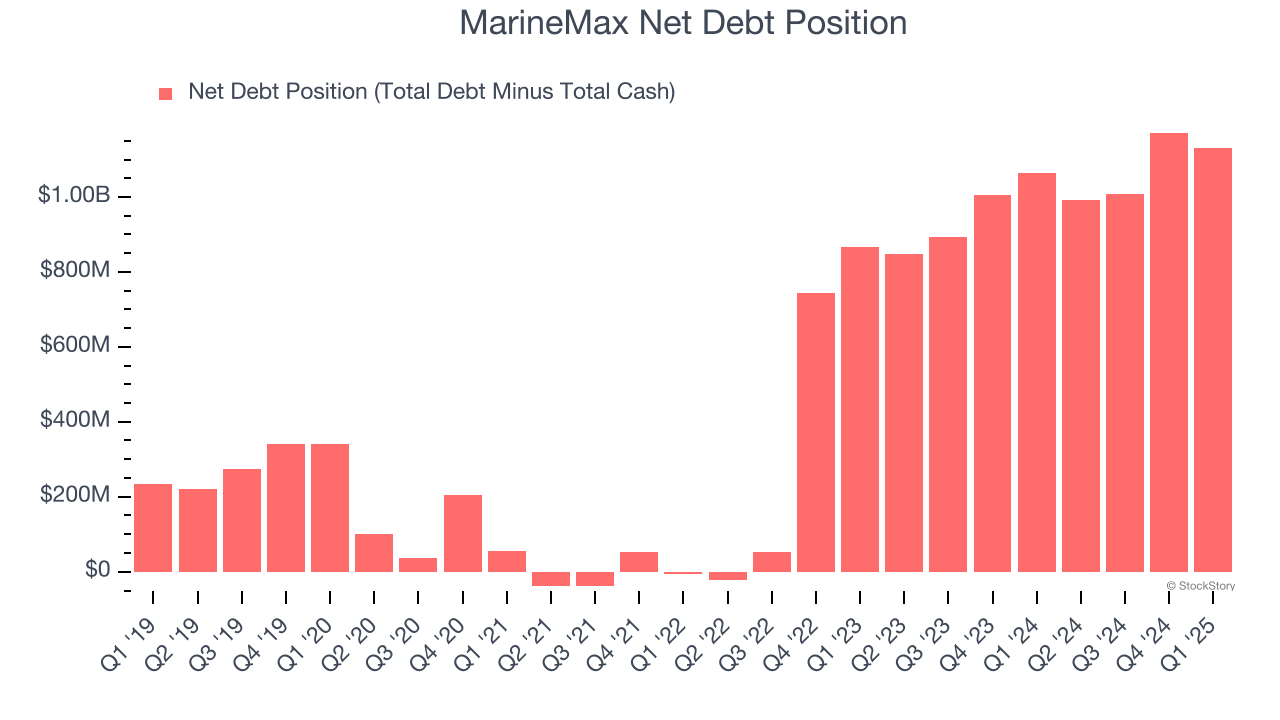
3. Short Cash Runway Exposes Shareholders to Potential Dilution
As long-term investors, the risk we care about most is the permanent loss of capital, which can happen when a company goes bankrupt or raises money from a disadvantaged position. This is separate from short-term stock price volatility, something we are much less bothered by.
MarineMax burned through $50.95 million of cash over the last year, and its $1.33 billion of debt exceeds the $203.5 million of cash on its balance sheet. This is a deal breaker for us because indebted loss-making companies spell trouble.
Unless the MarineMax’s fundamentals change quickly, it might find itself in a position where it must raise capital from investors to continue operating. Whether that would be favorable is unclear because dilution is a headwind for shareholder returns.
We remain cautious of MarineMax until it generates consistent free cash flow or any of its announced financing plans materialize on its balance sheet.
Final Judgment
MarineMax isn’t a terrible business, but it doesn’t pass our quality test. Following the recent decline, the stock trades at 8.2× forward P/E (or $21.51 per share). While this valuation is optically cheap, the potential downside is big given its shaky fundamentals. We're fairly confident there are better stocks to buy right now. We’d recommend looking at a fast-growing restaurant franchise with an A+ ranch dressing sauce.
Stocks We Like More Than MarineMax
The market surged in 2024 and reached record highs after Donald Trump’s presidential victory in November, but questions about new economic policies are adding much uncertainty for 2025.
While the crowd speculates what might happen next, we’re homing in on the companies that can succeed regardless of the political or macroeconomic environment. Put yourself in the driver’s seat and build a durable portfolio by checking out our Top 9 Market-Beating Stocks. This is a curated list of our High Quality stocks that have generated a market-beating return of 176% over the last five years.
Stocks that made our list in 2020 include now familiar names such as Nvidia (+1,545% between March 2020 and March 2025) as well as under-the-radar businesses like the once-micro-cap company Tecnoglass (+1,754% five-year return). Find your next big winner with StockStory today.


