Off-price retail company Burlington Stores (NYSE: BURL) fell short of the market’s revenue expectations in Q1 CY2025, but sales rose 6% year on year to $2.50 billion. Next quarter’s revenue guidance of $2.61 billion underwhelmed, coming in 1.5% below analysts’ estimates. Its non-GAAP profit of $1.60 per share was 12% above analysts’ consensus estimates.
Is now the time to buy Burlington? Find out by accessing our full research report, it’s free.
Burlington (BURL) Q1 CY2025 Highlights:
- Revenue: $2.50 billion vs analyst estimates of $2.53 billion (6% year-on-year growth, 0.9% miss)
- Adjusted EPS: $1.60 vs analyst estimates of $1.43 (12% beat)
- Adjusted EBITDA: $238.1 million vs analyst estimates of $224.3 million (9.5% margin, 6.2% beat)
- Revenue Guidance for Q2 CY2025 is $2.61 billion at the midpoint, below analyst estimates of $2.65 billion
- Management reiterated its full-year Adjusted EPS guidance of $9 at the midpoint
- Operating Margin: 9.2%, up from 5.3% in the same quarter last year
- Free Cash Flow was -$438.6 million compared to -$115.5 million in the same quarter last year
- Locations: 1,115 at quarter end, up from 1,021 in the same quarter last year
- Same-Store Sales were flat year on year (2% in the same quarter last year)
- Market Capitalization: $15.03 billion
Michael O’Sullivan, CEO, stated, “Total Sales increased 6% and Comparable Store Sales were Flat for the first quarter, in line with the midpoint of our guidance. Adjusted EBIT Margin and EPS were ahead of guidance with approximately half of this beat to guidance coming from favorable timing of expenses that will negatively impact Q2.”
Company Overview
Founded in 1972 as a discount coat and outerwear retailer, Burlington Stores (NYSE: BURL) is now an off-price retailer that has broadened into general apparel, footwear, and home goods.
Sales Growth
A company’s long-term performance is an indicator of its overall quality. Any business can have short-term success, but a top-tier one grows for years.
With $10.78 billion in revenue over the past 12 months, Burlington is a mid-sized retailer, which sometimes brings disadvantages compared to larger competitors benefiting from better economies of scale.
As you can see below, Burlington’s 8% annualized revenue growth over the last six years (we compare to 2019 to normalize for COVID-19 impacts) was mediocre, but to its credit, it opened new stores and increased sales at existing, established locations.
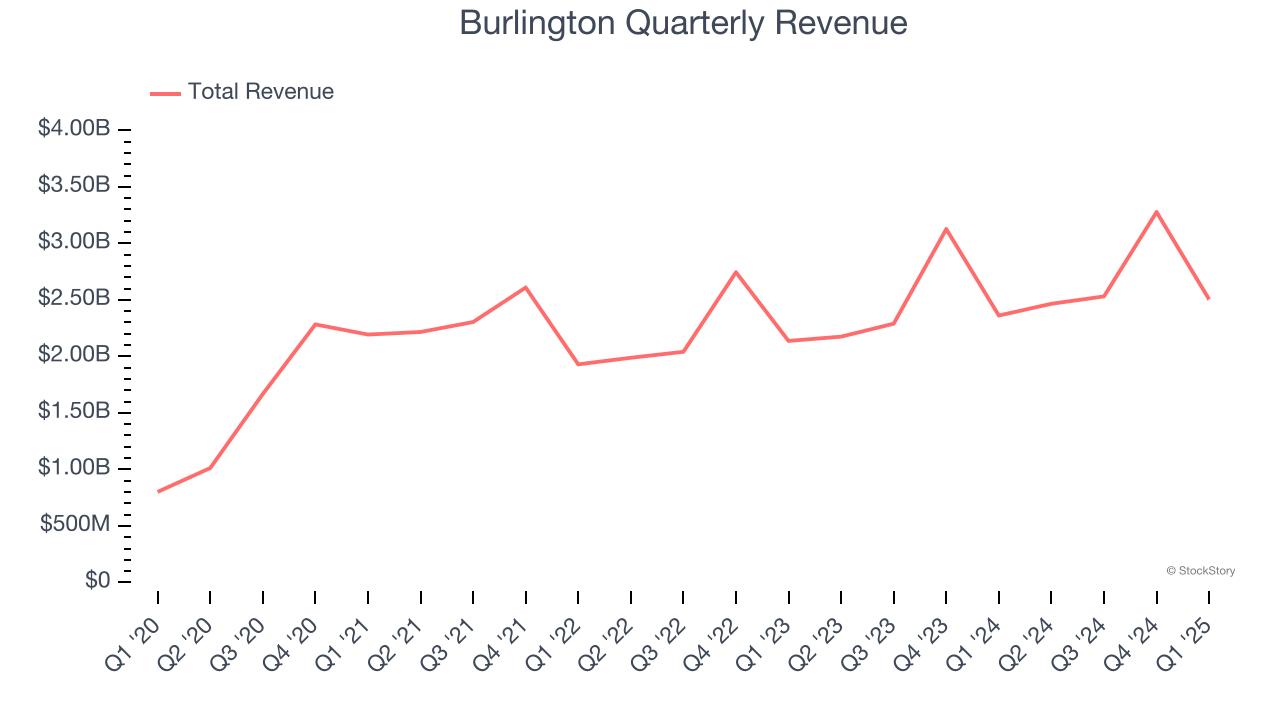
This quarter, Burlington’s revenue grew by 6% year on year to $2.50 billion, missing Wall Street’s estimates. Company management is currently guiding for a 6% year-on-year increase in sales next quarter.
Looking further ahead, sell-side analysts expect revenue to grow 8.8% over the next 12 months, similar to its six-year rate. This projection is eye-popping for a company of its scale and indicates the market sees success for its products.
Today’s young investors won’t have read the timeless lessons in Gorilla Game: Picking Winners In High Technology because it was written more than 20 years ago when Microsoft and Apple were first establishing their supremacy. But if we apply the same principles, then enterprise software stocks leveraging their own generative AI capabilities may well be the Gorillas of the future. So, in that spirit, we are excited to present our Special Free Report on a profitable, fast-growing enterprise software stock that is already riding the automation wave and looking to catch the generative AI next.
Store Performance
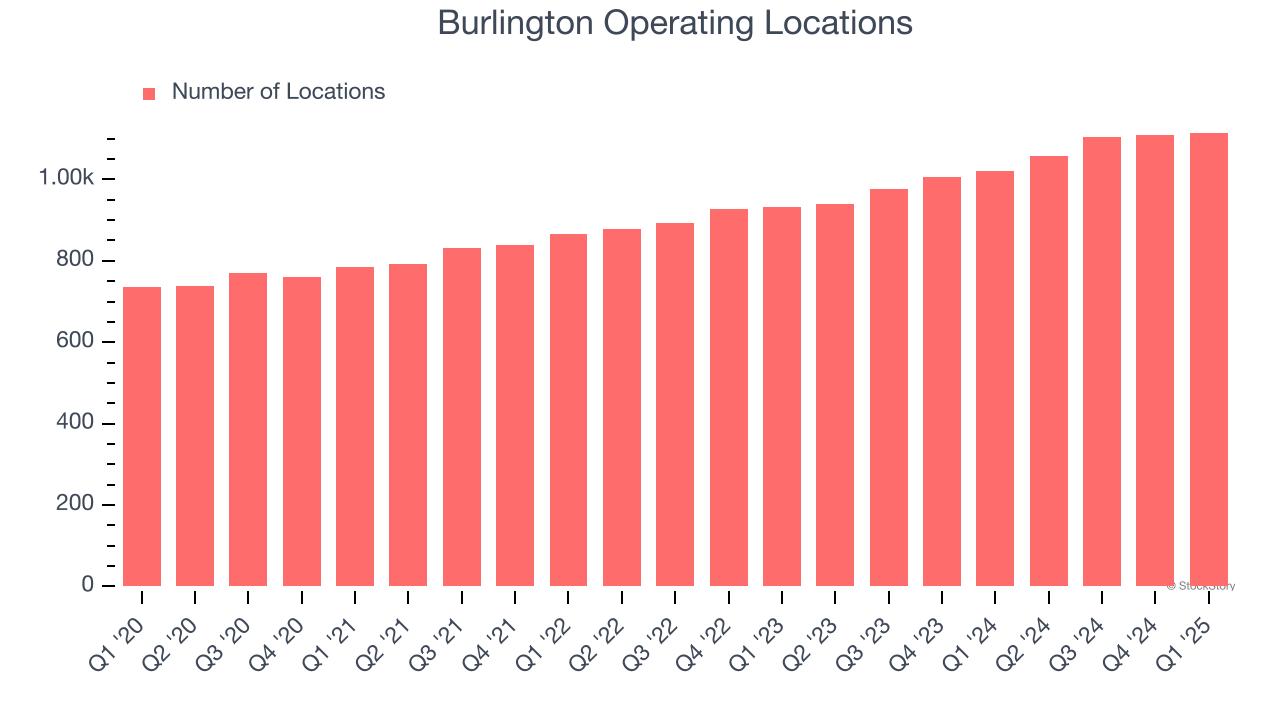
Number of Stores
Burlington operated 1,115 locations in the latest quarter. It has opened new stores at a rapid clip over the last two years, averaging 9.9% annual growth, much faster than the broader consumer retail sector. This gives it a chance to become a large, scaled business over time.
When a retailer opens new stores, it usually means it’s investing for growth because demand is greater than supply, especially in areas where consumers may not have a store within reasonable driving distance.
Same-Store Sales
A company's store base only paints one part of the picture. When demand is high, it makes sense to open more. But when demand is low, it’s prudent to close some locations and use the money in other ways. Same-store sales provides a deeper understanding of this issue because it measures organic growth at brick-and-mortar shops for at least a year.
Burlington’s demand has been spectacular for a retailer over the last two years. On average, the company has increased its same-store sales by an impressive 3.2% per year. This performance suggests its rollout of new stores is beneficial for shareholders. We like this backdrop because it gives Burlington multiple ways to win: revenue growth can come from new stores, e-commerce, or increased foot traffic and higher sales per customer at existing locations.
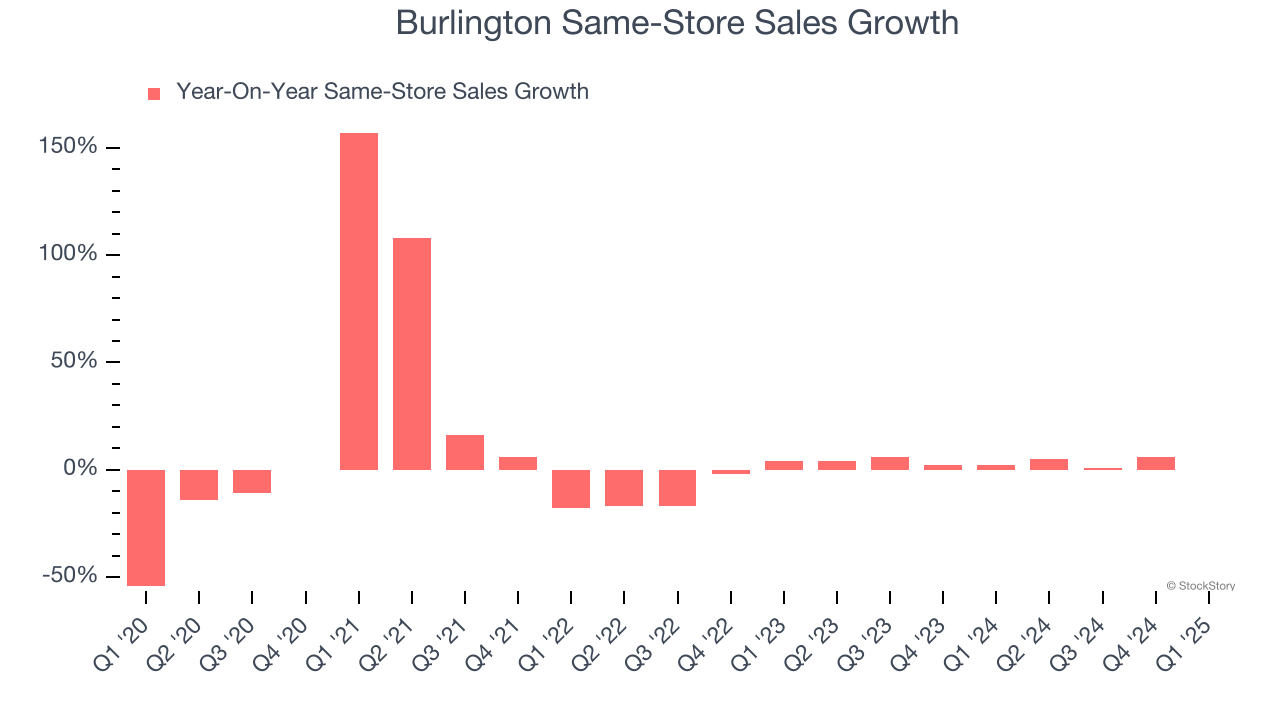
In the latest quarter, Burlington’s year on year same-store sales were flat. This was a meaningful deceleration from its historical levels. We’ll be watching closely to see if Burlington can reaccelerate growth.
Key Takeaways from Burlington’s Q1 Results
We enjoyed seeing Burlington beat analysts’ EPS and EBITDA expectations this quarter. On the other hand, its revenue guidance for next quarter missed and its full-year EPS guidance fell short of Wall Street’s estimates. Overall, this quarter could have been better, but the stock traded up 5.5% to $252 immediately following the results.
Is Burlington an attractive investment opportunity at the current price? If you’re making that decision, you should consider the bigger picture of valuation, business qualities, as well as the latest earnings. We cover that in our actionable full research report which you can read here, it’s free.


