Membership-only discount retailer Costco (NASDAQ: COST) met Wall Street’s revenue expectations in Q2 CY2025, with sales up 8% year on year to $63.21 billion. Its GAAP profit of $4.28 per share was 1.2% above analysts’ consensus estimates.
Is now the time to buy Costco? Find out by accessing our full research report, it’s free.
Costco (COST) Q2 CY2025 Highlights:
- Revenue: $63.21 billion vs analyst estimates of $63.19 billion (8% year-on-year growth, in line)
- EPS (GAAP): $4.28 vs analyst estimates of $4.23 (1.2% beat)
- Adjusted EBITDA: $3.08 billion vs analyst estimates of $3.02 billion (4.9% margin, 2.2% beat)
- Operating Margin: 4%, in line with the same quarter last year
- Free Cash Flow Margin: 3.7%, similar to the same quarter last year
- Locations: 905 at quarter end, up from 876 in the same quarter last year
- Same-Store Sales rose 5.7% year on year, in line with the same quarter last year
- Market Capitalization: $449.5 billion
Company Overview
Designed to be a one-stop shop for the suburban consumer, Costco (NASDAQ: COST) is a membership-only retail chain that sells groceries, apparel, toys, and household items, often in bulk quantities.
Sales Growth
A company’s long-term performance is an indicator of its overall quality. Any business can put up a good quarter or two, but many enduring ones grow for years.
With $268.8 billion in revenue over the past 12 months, Costco is a behemoth in the consumer retail sector and benefits from economies of scale, giving it an edge in distribution. This also enables it to gain more leverage on its fixed costs than smaller competitors and the flexibility to offer lower prices.
As you can see below, Costco’s 10.3% annualized revenue growth over the last six years (we compare to 2019 to normalize for COVID-19 impacts) was decent as it opened new stores and increased sales at existing, established locations.
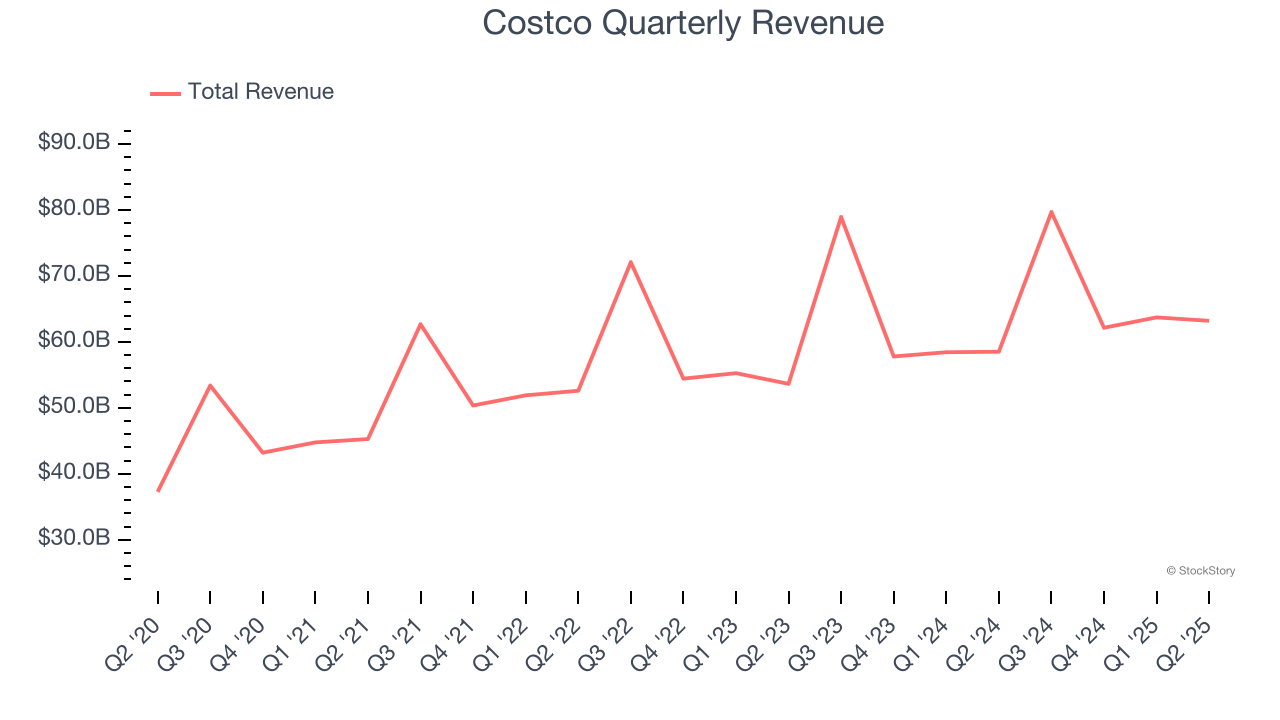
This quarter, Costco grew its revenue by 8% year on year, and its $63.21 billion of revenue was in line with Wall Street’s estimates.
Looking ahead, sell-side analysts expect revenue to grow 6.8% over the next 12 months, a deceleration versus the last six years. We still think its growth trajectory is attractive given its scale and indicates the market is forecasting success for its products.
Here at StockStory, we certainly understand the potential of thematic investing. Diverse winners from Microsoft (MSFT) to Alphabet (GOOG), Coca-Cola (KO) to Monster Beverage (MNST) could all have been identified as promising growth stories with a megatrend driving the growth. So, in that spirit, we’ve identified a relatively under-the-radar profitable growth stock benefiting from the rise of AI, available to you FREE via this link.
Store Performance
Number of Stores
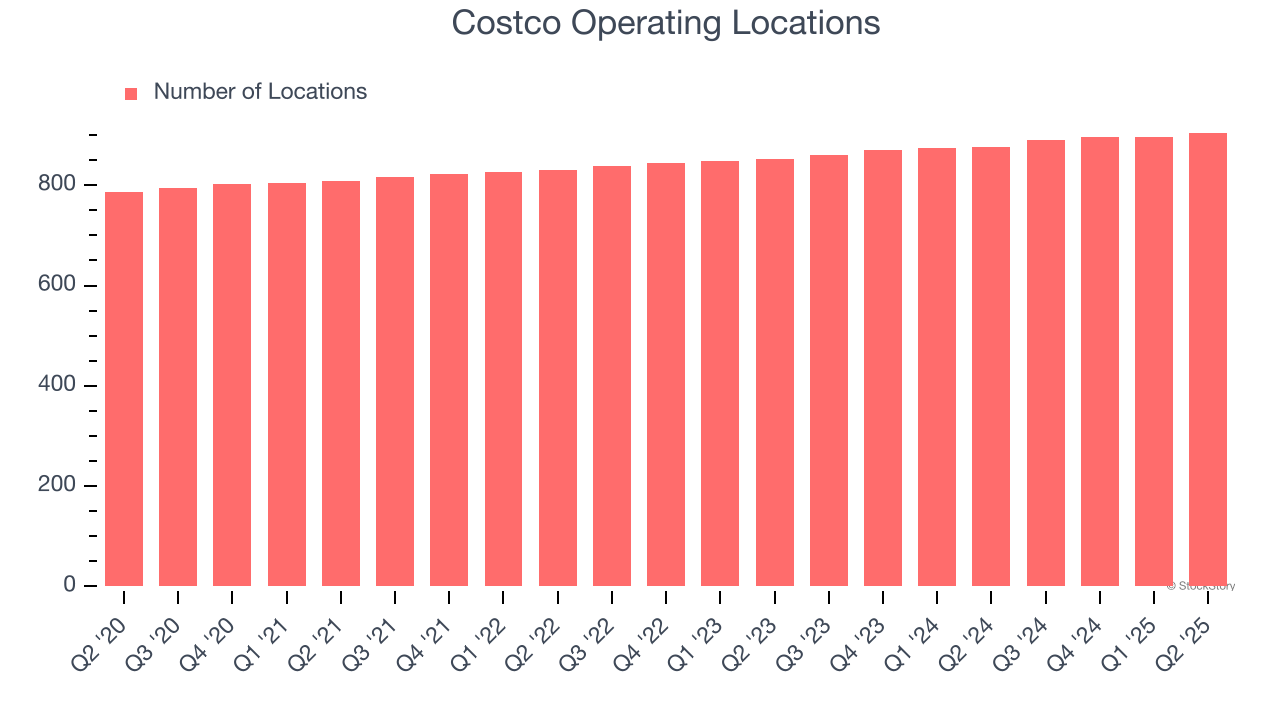
A retailer’s store count often determines how much revenue it can generate.
Costco operated 905 locations in the latest quarter. It has opened new stores quickly over the last two years, averaging 3% annual growth, faster than the broader consumer retail sector.
When a retailer opens new stores, it usually means it’s investing for growth because demand is greater than supply, especially in areas where consumers may not have a store within reasonable driving distance.
Same-Store Sales
A company's store base only paints one part of the picture. When demand is high, it makes sense to open more. But when demand is low, it’s prudent to close some locations and use the money in other ways. Same-store sales is an industry measure of whether revenue is growing at those existing stores and is driven by customer visits (often called traffic) and the average spending per customer (ticket).
Costco has been one of the most successful retailers over the last two years thanks to skyrocketing demand within its existing locations. On average, the company has posted exceptional year-on-year same-store sales growth of 5%. This performance suggests its rollout of new stores is beneficial for shareholders. We like this backdrop because it gives Costco multiple ways to win: revenue growth can come from new stores, e-commerce, or increased foot traffic and higher sales per customer at existing locations.
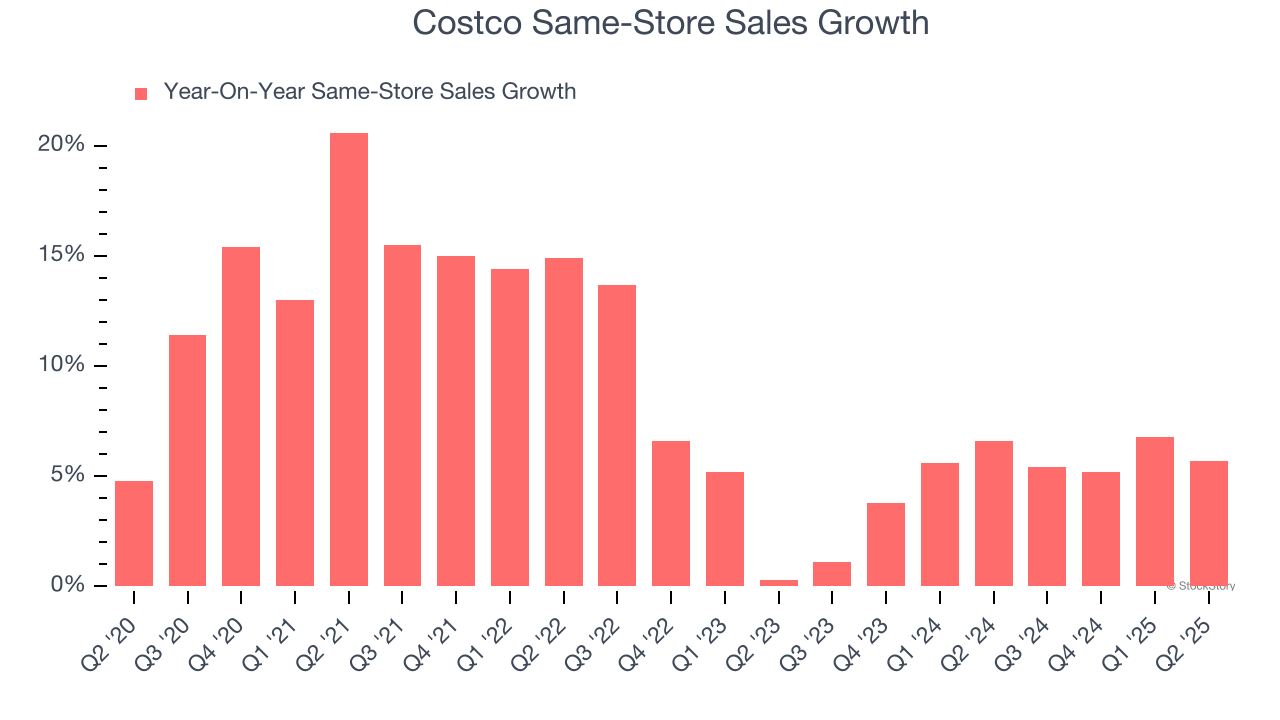
In the latest quarter, Costco’s same-store sales rose 5.7% year on year. This performance was more or less in line with its historical levels.
Key Takeaways from Costco’s Q2 Results
We were impressed by how significantly Costco blew past analysts’ gross margin expectations this quarter. We were also happy its EPS and EBITDA outperformed Wall Street’s estimates. Overall, this print had some key positives. The stock remained flat at $1,015 immediately after reporting.
So should you invest in Costco right now? What happened in the latest quarter matters, but not as much as longer-term business quality and valuation, when deciding whether to invest in this stock. We cover that in our actionable full research report which you can read here, it’s free.


