
E-commerce pet food and supplies retailer Chewy (NYSE: CHWY) beat Wall Street’s revenue expectations in Q1 CY2025, with sales up 8.3% year on year to $3.12 billion. Its non-GAAP profit of $0.35 per share was 3.2% above analysts’ consensus estimates.
Is now the time to buy Chewy? Find out by accessing our full research report, it’s free.
Chewy (CHWY) Q1 CY2025 Highlights:
- Revenue: $3.12 billion vs analyst estimates of $3.08 billion (8.3% year-on-year growth, 1.1% beat)
- Adjusted EPS: $0.35 vs analyst estimates of $0.34 (3.2% beat)
- Adjusted EBITDA: $192.7 million vs analyst estimates of $190.7 million (6.2% margin, 1.1% beat)
- Operating Margin: 2.5%, in line with the same quarter last year
- Free Cash Flow Margin: 1.6%, down from 4.8% in the previous quarter
- Market Capitalization: $19 billion
Company Overview
Founded by Ryan Cohen, who later became known for his involvement in GameStop, Chewy (NYSE: CHWY) is an online retailer specializing in pet food, supplies, and healthcare services.
Sales Growth
A company’s long-term sales performance can indicate its overall quality. Any business can experience short-term success, but top-performing ones enjoy sustained growth for years. Unfortunately, Chewy’s 9.3% annualized revenue growth over the last three years was mediocre. This was below our standard for the consumer internet sector and is a rough starting point for our analysis.
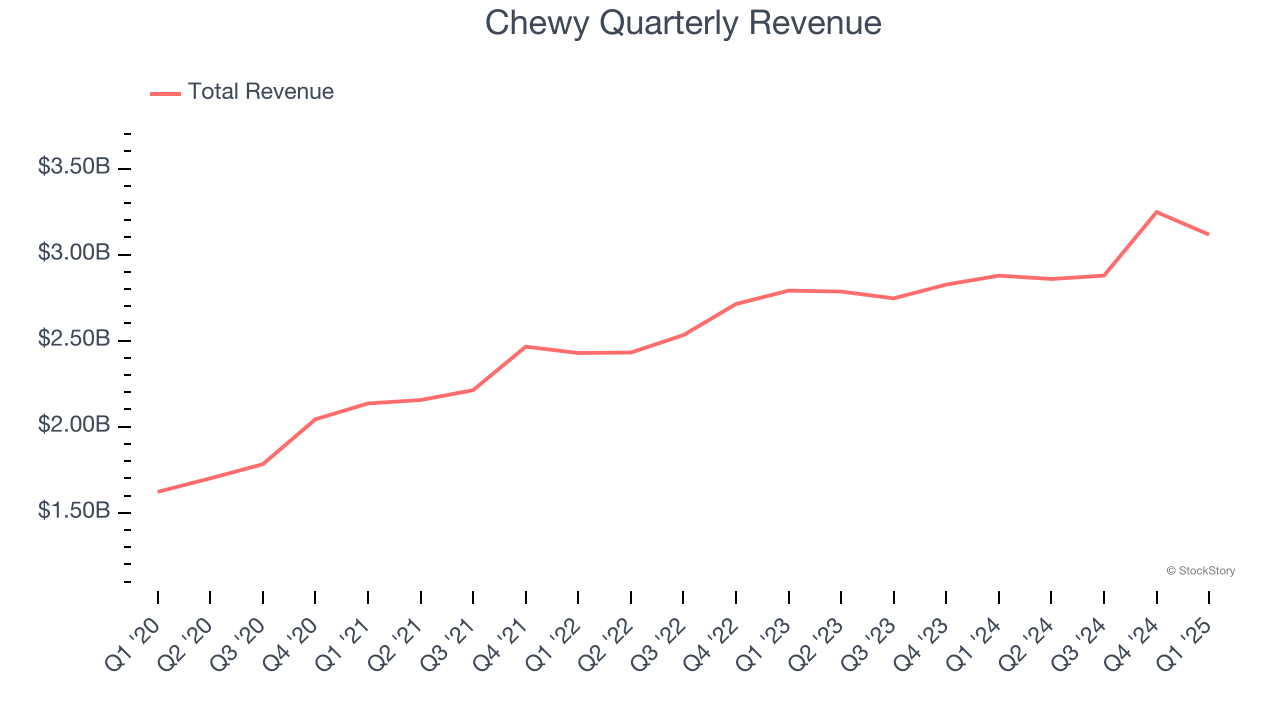
This quarter, Chewy reported year-on-year revenue growth of 8.3%, and its $3.12 billion of revenue exceeded Wall Street’s estimates by 1.1%.
Looking ahead, sell-side analysts expect revenue to grow 4.7% over the next 12 months, a deceleration versus the last three years. This projection is underwhelming and implies its products and services will face some demand challenges.
Software is eating the world and there is virtually no industry left that has been untouched by it. That drives increasing demand for tools helping software developers do their jobs, whether it be monitoring critical cloud infrastructure, integrating audio and video functionality, or ensuring smooth content streaming. Click here to access a free report on our 3 favorite stocks to play this generational megatrend.
Cash Is King
Although EBITDA is undoubtedly valuable for assessing company performance, we believe cash is king because you can’t use accounting profits to pay the bills.
Chewy has shown mediocre cash profitability over the last two years, giving the company limited opportunities to return capital to shareholders. Its free cash flow margin averaged 3.1%, subpar for a consumer internet business.
Taking a step back, an encouraging sign is that Chewy’s margin expanded by 4.2 percentage points over the last few years. We have no doubt shareholders would like to continue seeing its cash conversion rise as it gives the company more optionality.
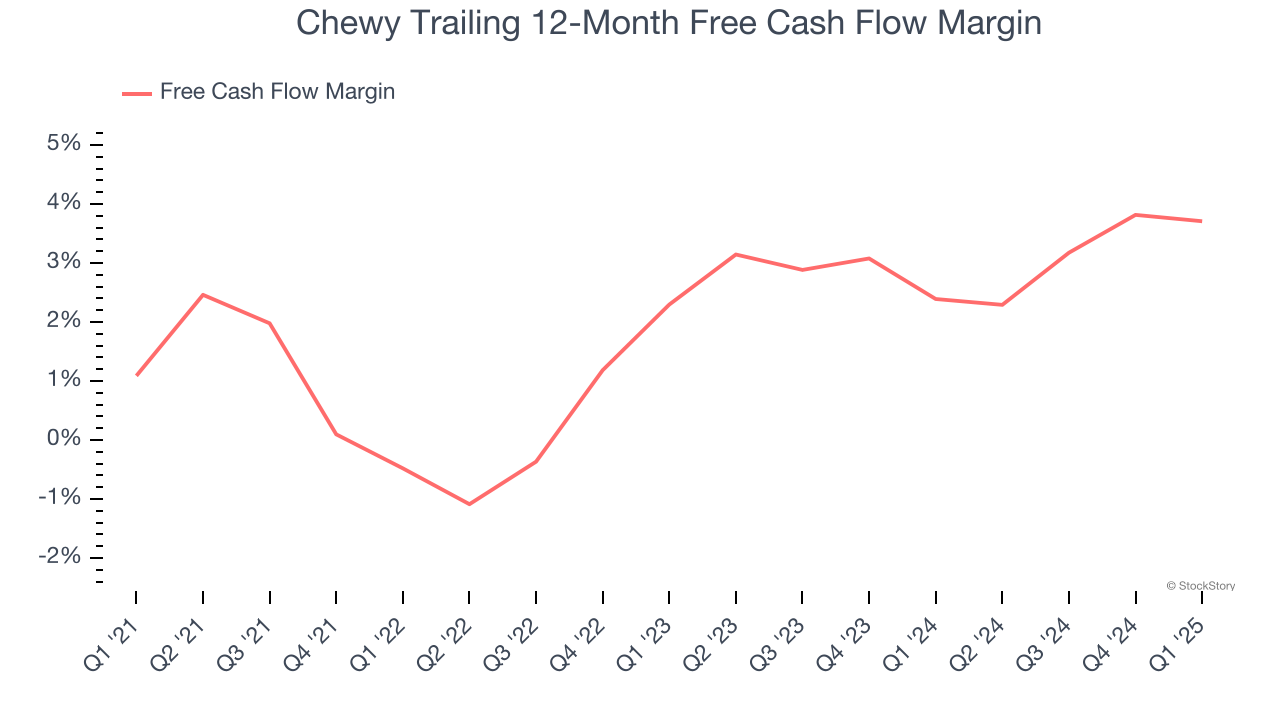
Chewy’s free cash flow clocked in at $48.7 million in Q1, equivalent to a 1.6% margin. This cash profitability was in line with the comparable period last year but below its two-year average. In a silo, this isn’t a big deal because investment needs can be seasonal, but we’ll be watching to see if the trend extrapolates into future quarters.
Key Takeaways from Chewy’s Q1 Results
It was good to see Chewy narrowly top analysts’ revenue and EBITDA expectations this quarter. We were also happy its EPS outperformed Wall Street’s estimates. Overall, this print had some key positives, but given the valuation going into the quarter, investors were likely hoping for more. Shares traded down 5.4% to $43.30 immediately following the results.
Is Chewy an attractive investment opportunity right now? If you’re making that decision, you should consider the bigger picture of valuation, business qualities, as well as the latest earnings. We cover that in our actionable full research report which you can read here, it’s free.


