Shareholders of Integral Ad Science would probably like to forget the past six months even happened. The stock dropped 22.6% and now trades at $8.08. This might have investors contemplating their next move.
Following the pullback, is now a good time to buy IAS? Find out in our full research report, it’s free.
Why Does Integral Ad Science Spark Debate?
Founded in 2009, Integral Ad Science (NASDAQ: IAS) provides digital advertising verification and optimization solutions, ensuring that ads are viewable by real people in brand-safe environments across various platforms and devices.
Two Things to Like:
1. Customer Acquisition Costs Are Recovered in Record Time
The customer acquisition cost (CAC) payback period represents the months required to recover the cost of acquiring a new customer. Essentially, it’s the break-even point for sales and marketing investments. A shorter CAC payback period is ideal, as it implies better returns on investment and business scalability.
Integral Ad Science is extremely efficient at acquiring new customers, and its CAC payback period checked in at 8.2 months this quarter. The company’s rapid recovery of its customer acquisition costs means it can attempt to spur growth by increasing its sales and marketing investments.
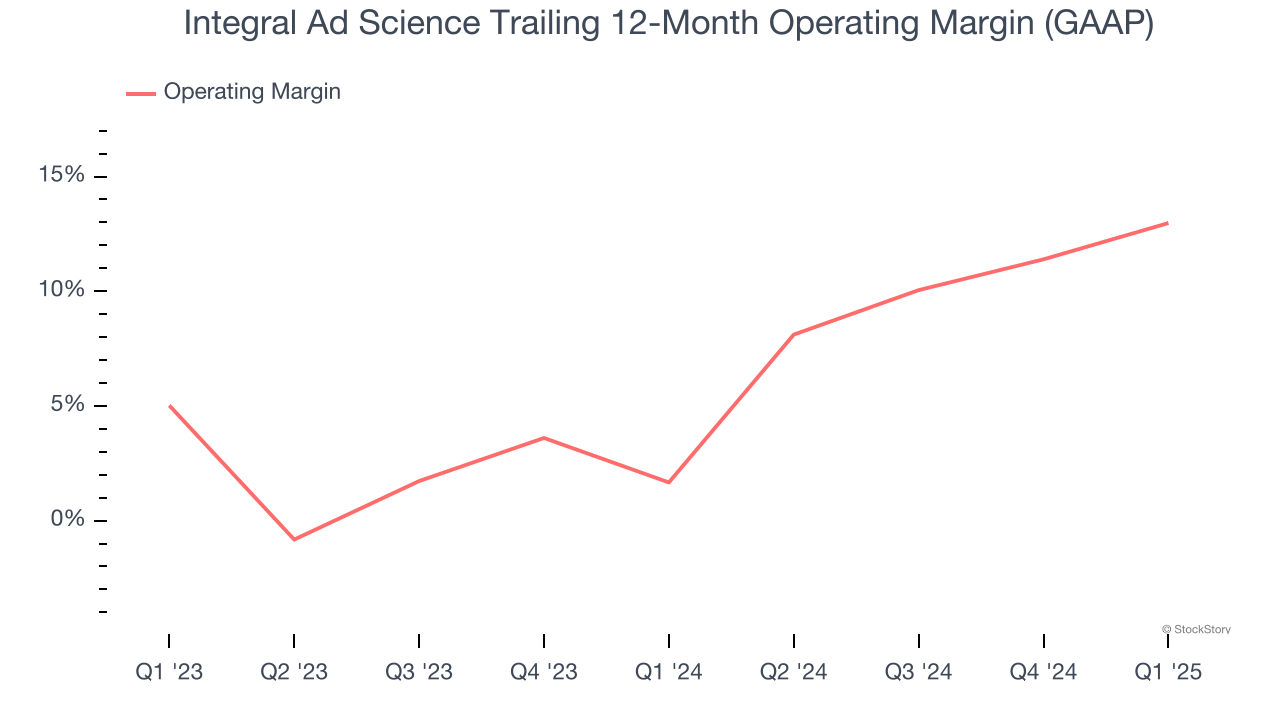
2. Operating Margin Rising, Profits Up
While many software businesses point investors to their adjusted profits, which exclude stock-based compensation (SBC), we prefer GAAP operating margin because SBC is a legitimate expense used to attract and retain talent. This is one of the best measures of profitability because it shows how much money a company takes home after developing, marketing, and selling its products.
Analyzing the trend in its profitability, Integral Ad Science’s operating margin rose by 11.3 percentage points over the last year, as its sales growth gave it operating leverage. Its operating margin for the trailing 12 months was 13%.
One Reason to be Careful:
Long-Term Revenue Growth Disappoints
Examining a company’s long-term performance can provide clues about its quality. Even a bad business can shine for one or two quarters, but a top-tier one grows for years. Over the last three years, Integral Ad Science grew its sales at a 16.7% compounded annual growth rate. Although this growth is acceptable on an absolute basis, it fell slightly short of our standards for the software sector, which enjoys a number of secular tailwinds. Luckily, there are other things to like about Integral Ad Science. 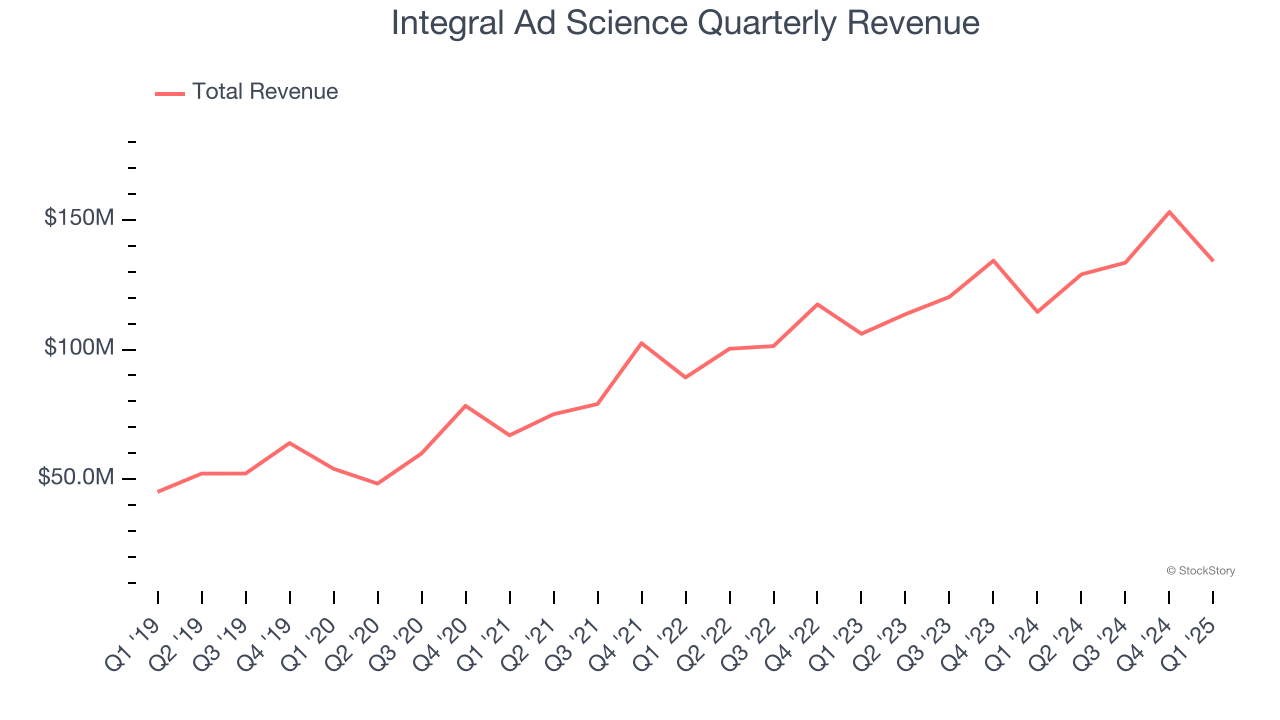
Final Judgment
Integral Ad Science’s positive characteristics outweigh the negatives. After the recent drawdown, the stock trades at 2.2× forward price-to-sales (or $8.08 per share). Is now the time to initiate a position? See for yourself in our comprehensive research report, it’s free.
Stocks We Like Even More Than Integral Ad Science
Market indices reached historic highs following Donald Trump’s presidential victory in November 2024, but the outlook for 2025 is clouded by new trade policies that could impact business confidence and growth.
While this has caused many investors to adopt a "fearful" wait-and-see approach, we’re leaning into our best ideas that can grow regardless of the political or macroeconomic climate. Take advantage of Mr. Market by checking out our Top 6 Stocks for this week. This is a curated list of our High Quality stocks that have generated a market-beating return of 183% over the last five years (as of March 31st 2025).
Stocks that made our list in 2020 include now familiar names such as Nvidia (+1,545% between March 2020 and March 2025) as well as under-the-radar businesses like the once-micro-cap company Kadant (+351% five-year return). Find your next big winner with StockStory today.


