
Shareholders of CSW would probably like to forget the past six months even happened. The stock dropped 23.4% and now trades at $305.10. This was partly due to its softer quarterly results and may have investors wondering how to approach the situation.
Following the pullback, is now an opportune time to buy CSWI? Find out in our full research report, it’s free.
Why Is CSWI a Good Business?
With over two centuries of combined operations manufacturing and supplying, CSW (NASDAQ: CSWI) offers special chemicals, coatings, sealants, and lubricants for various industries.
1. Skyrocketing Revenue Shows Strong Momentum
A company’s long-term performance is an indicator of its overall quality. Any business can put up a good quarter or two, but many enduring ones grow for years. Thankfully, CSW’s 17.9% annualized revenue growth over the last five years was incredible. Its growth beat the average industrials company and shows its offerings resonate with customers. 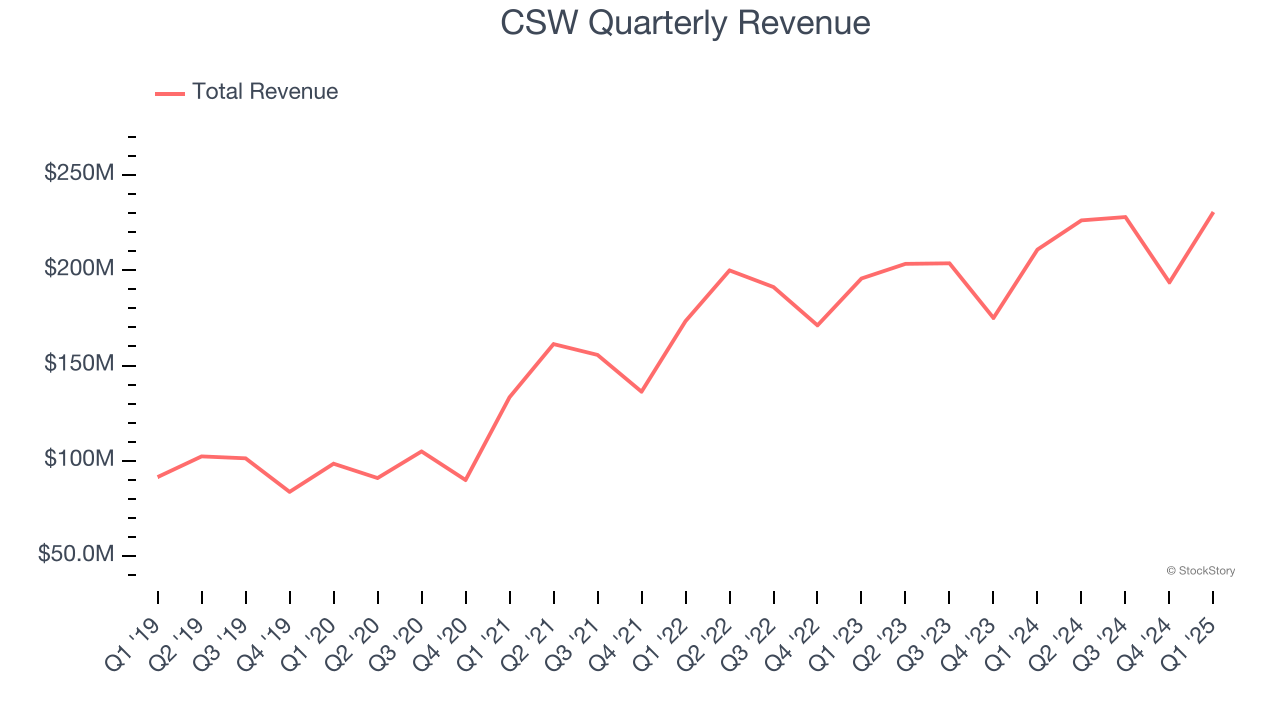
2. Operating Margin Reveals a Well-Run Organization
Operating margin is an important measure of profitability as it shows the portion of revenue left after accounting for all core expenses – everything from the cost of goods sold to advertising and wages. It’s also useful for comparing profitability across companies with different levels of debt and tax rates because it excludes interest and taxes.
CSW has been a well-oiled machine over the last five years. It demonstrated elite profitability for an industrials business, boasting an average operating margin of 18.8%. This result isn’t surprising as its high gross margin gives it a favorable starting point.

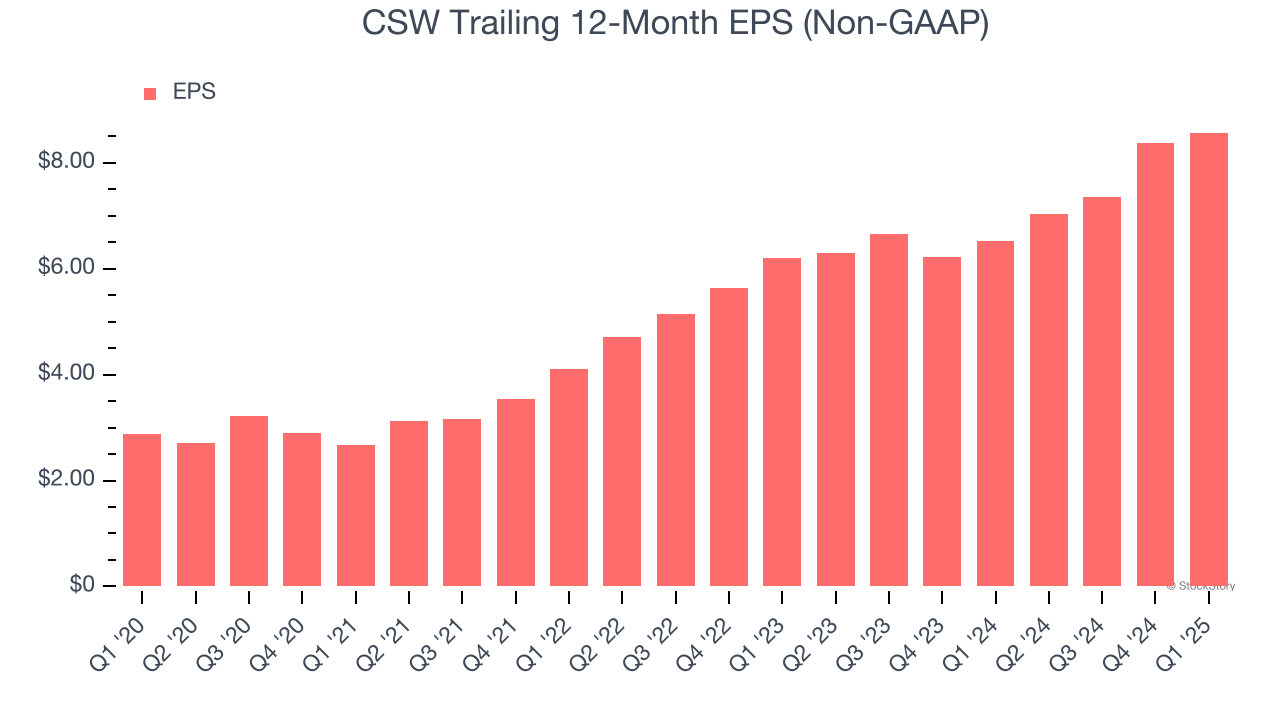
3. Outstanding Long-Term EPS Growth
We track the long-term change in earnings per share (EPS) because it highlights whether a company’s growth is profitable.
CSW’s EPS grew at an astounding 24.5% compounded annual growth rate over the last five years, higher than its 17.9% annualized revenue growth. This tells us the company became more profitable on a per-share basis as it expanded.
Final Judgment
These are just a few reasons why we're bullish on CSW. With the recent decline, the stock trades at 32.1× forward P/E (or $305.10 per share). Is now the right time to buy? See for yourself in our full research report, it’s free.
High-Quality Stocks for All Market Conditions
Market indices reached historic highs following Donald Trump’s presidential victory in November 2024, but the outlook for 2025 is clouded by new trade policies that could impact business confidence and growth.
While this has caused many investors to adopt a "fearful" wait-and-see approach, we’re leaning into our best ideas that can grow regardless of the political or macroeconomic climate. Take advantage of Mr. Market by checking out our Top 5 Strong Momentum Stocks for this week. This is a curated list of our High Quality stocks that have generated a market-beating return of 183% over the last five years (as of March 31st 2025).
Stocks that made our list in 2020 include now familiar names such as Nvidia (+1,545% between March 2020 and March 2025) as well as under-the-radar businesses like the once-micro-cap company Tecnoglass (+1,754% five-year return). Find your next big winner with StockStory today.


