
Over the past six months, Wayfair has been a great trade, beating the S&P 500 by 25%. Its stock price has climbed to $55.95, representing a healthy 30.4% increase. This performance may have investors wondering how to approach the situation.
Is there a buying opportunity in Wayfair, or does it present a risk to your portfolio? Get the full stock story straight from our expert analysts, it’s free.
Why Do We Think Wayfair Will Underperform?
We’re glad investors have benefited from the price increase, but we're sitting this one out for now. Here are three reasons why we avoid W and a stock we'd rather own.
1. Declining Active Customers Reflect Product Weakness
As an online retailer, Wayfair generates revenue growth by expanding its number of users and the average order size in dollars.
Wayfair struggled with new customer acquisition over the last two years as its active customers have declined by 2.1% annually to 21.1 million in the latest quarter. This performance isn't ideal because internet usage is secular, meaning there are typically unaddressed market opportunities. If Wayfair wants to accelerate growth, it likely needs to enhance the appeal of its current offerings or innovate with new products. 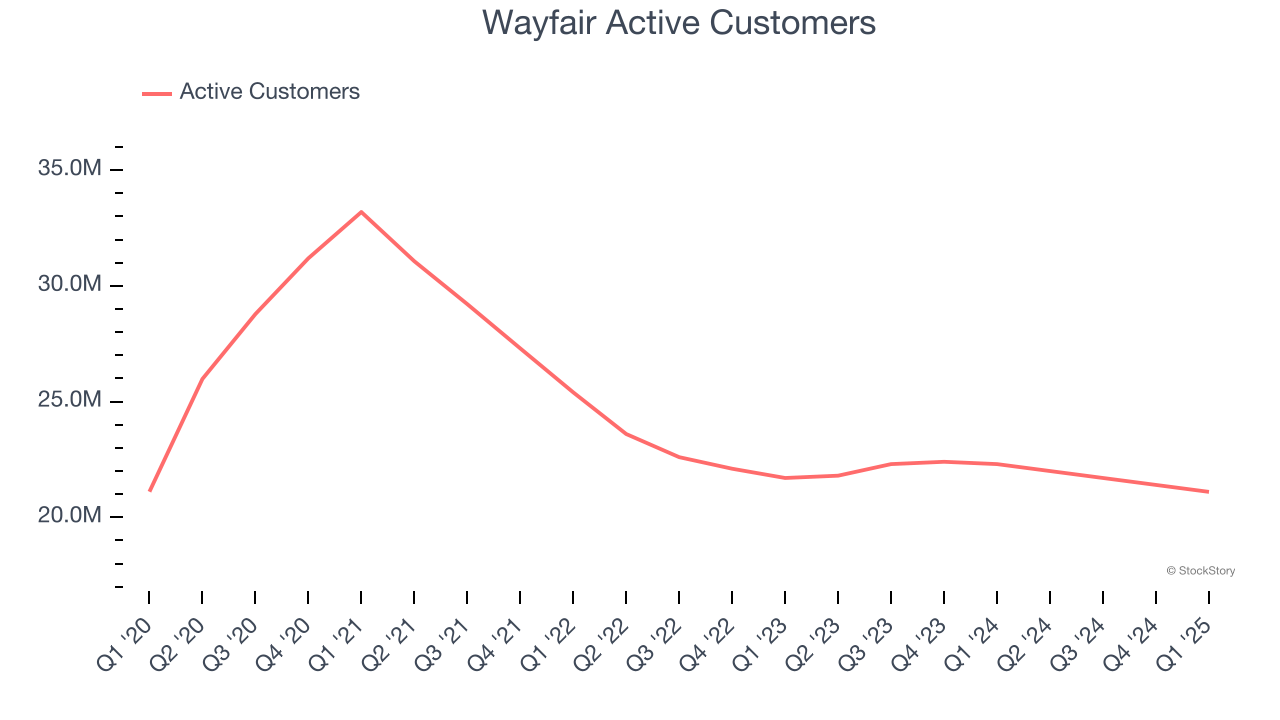
2. Low Gross Margin Reveals Weak Structural Profitability
For online retail (separate from online marketplaces) businesses like Wayfair, gross profit tells us how much money the company gets to keep after covering the base cost of its products and services, which typically include the cost of acquiring the products sold, shipping and fulfillment, customer service, and digital infrastructure.
Wayfair’s unit economics are far below other consumer internet companies because it must carry inventories as an online retailer. This means it has relatively higher capital intensity than a pure software business like Meta or Airbnb and signals it operates in a competitive market. As you can see below, it averaged a 30.5% gross margin over the last two years. That means Wayfair paid its providers a lot of money ($69.52 for every $100 in revenue) to run its business. 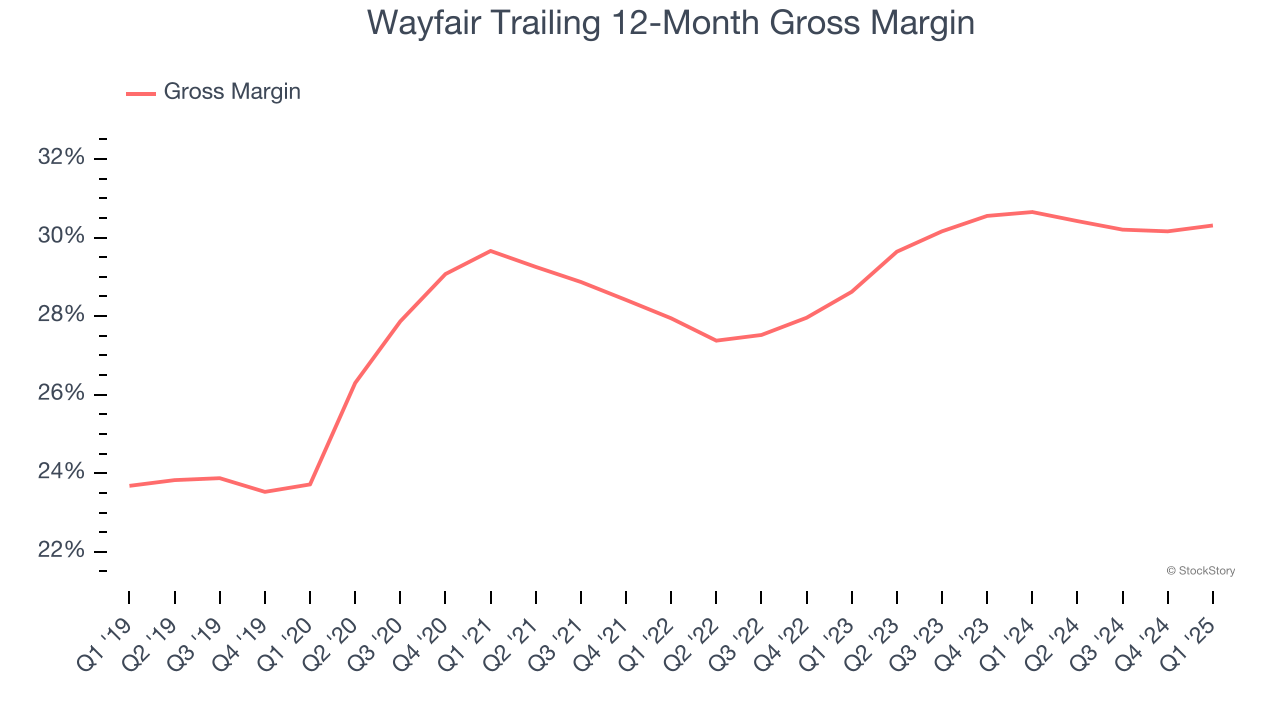
3. High Debt Levels Increase Risk
As long-term investors, the risk we care about most is the permanent loss of capital, which can happen when a company goes bankrupt or raises money from a disadvantaged position. This is separate from short-term stock price volatility, something we are much less bothered by.
Wayfair’s $3.91 billion of debt exceeds the $1.37 billion of cash on its balance sheet. Furthermore, its 5× net-debt-to-EBITDA ratio (based on its EBITDA of $484 million over the last 12 months) shows the company is overleveraged.
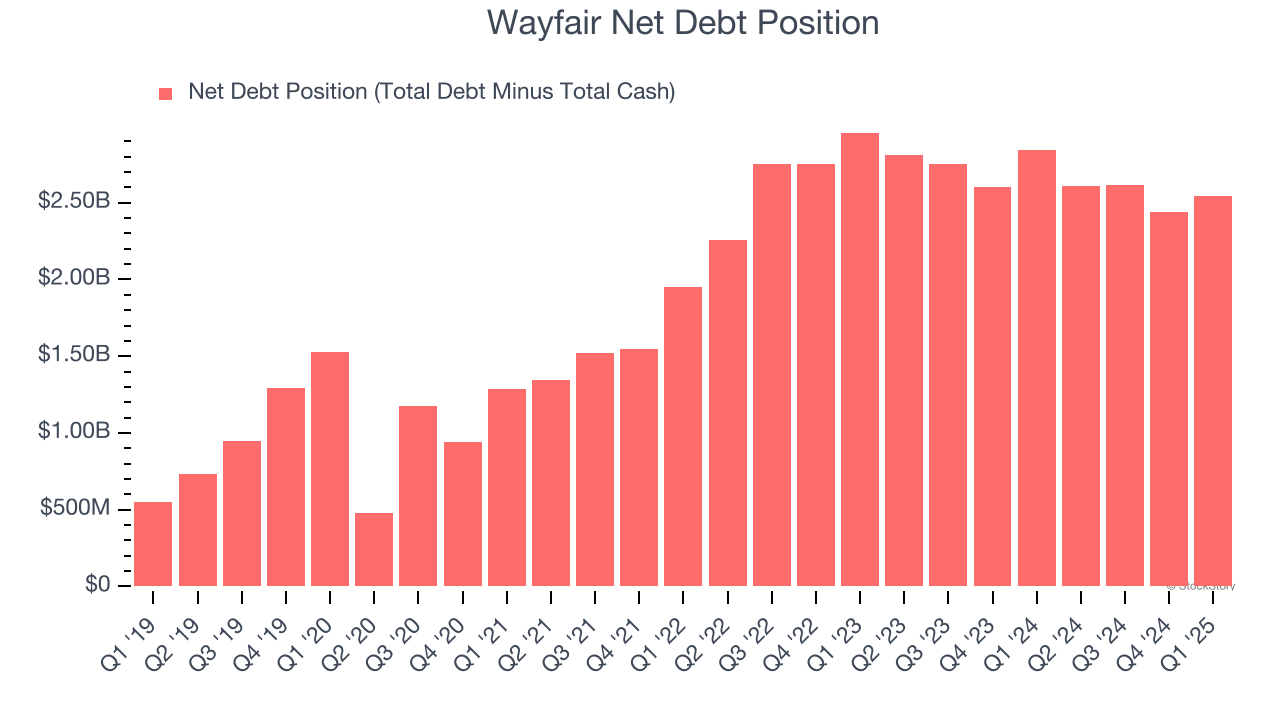
At this level of debt, incremental borrowing becomes increasingly expensive and credit agencies could downgrade the company’s rating if profitability falls. Wayfair could also be backed into a corner if the market turns unexpectedly – a situation we seek to avoid as investors in high-quality companies.
We hope Wayfair can improve its balance sheet and remain cautious until it increases its profitability or pays down its debt.
Final Judgment
We see the value of companies helping consumers, but in the case of Wayfair, we’re out. With its shares topping the market in recent months, the stock trades at 14.2× forward EV/EBITDA (or $55.95 per share). This multiple tells us a lot of good news is priced in - we think there are better opportunities elsewhere. We’d recommend looking at a safe-and-steady industrials business benefiting from an upgrade cycle.
High-Quality Stocks for All Market Conditions
The market surged in 2024 and reached record highs after Donald Trump’s presidential victory in November, but questions about new economic policies are adding much uncertainty for 2025.
While the crowd speculates what might happen next, we’re homing in on the companies that can succeed regardless of the political or macroeconomic environment. Put yourself in the driver’s seat and build a durable portfolio by checking out our Top 5 Strong Momentum Stocks for this week. This is a curated list of our High Quality stocks that have generated a market-beating return of 183% over the last five years (as of March 31st 2025).
Stocks that made our list in 2020 include now familiar names such as Nvidia (+1,545% between March 2020 and March 2025) as well as under-the-radar businesses like the once-micro-cap company Kadant (+351% five-year return). Find your next big winner with StockStory today.
StockStory is growing and hiring equity analyst and marketing roles. Are you a 0 to 1 builder passionate about the markets and AI? See the open roles here.