
Financial services giant PNC (NYSE: PNC) reported Q2 CY2025 results exceeding the market’s revenue expectations, with sales up 4.6% year on year to $5.66 billion. Its GAAP profit of $3.85 per share was 8.5% above analysts’ consensus estimates.
Is now the time to buy PNC Financial Services Group? Find out by accessing our full research report, it’s free.
PNC Financial Services Group (PNC) Q2 CY2025 Highlights:
- Net Interest Income: $3.56 billion vs analyst estimates of $3.55 billion (7.7% year-on-year growth, in line)
- Net Interest Margin: 2.8% vs analyst estimates of 2.8% (20 basis point year-on-year increase, 2.4 bps miss)
- Revenue: $5.66 billion vs analyst estimates of $5.59 billion (4.6% year-on-year growth, 1.3% beat)
- Efficiency Ratio: 60% vs analyst estimates of 60.3% (0.3 percentage point beat)
- EPS (GAAP): $3.85 vs analyst estimates of $3.55 (8.5% beat)
- Market Capitalization: $76 billion
Company Overview
Tracing its roots back to 1852 when Pittsburgh's industrial boom demanded stronger financial institutions, PNC (NYSE: PNC) is a diversified financial institution that provides retail banking, corporate banking, and asset management services through a coast-to-coast branch network.
Sales Growth
Two primary revenue streams drive bank earnings. While net interest income, which is earned by charging higher rates on loans than paid on deposits, forms the foundation, fee-based services across banking, credit, wealth management, and trading operations provide additional income.
Over the last five years, PNC Financial Services Group grew its revenue at a decent 5.4% compounded annual growth rate. Its growth was slightly above the average bank company and shows its offerings resonate with customers.
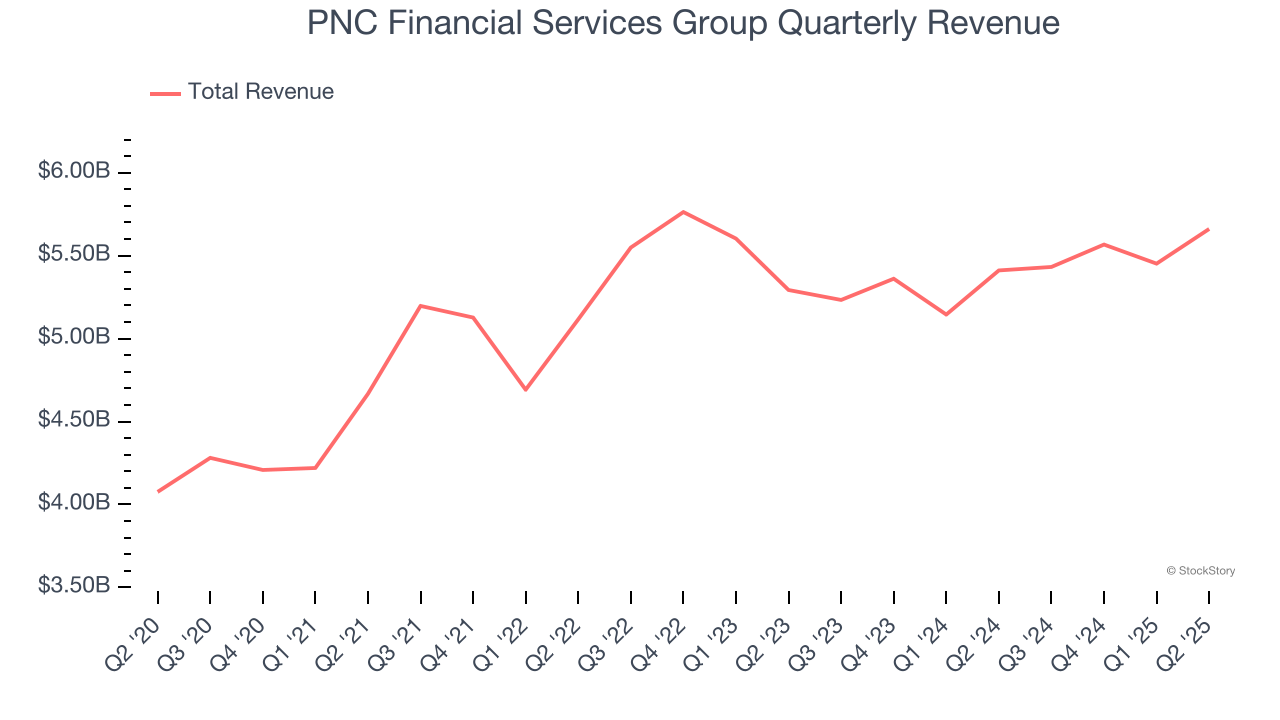
Long-term growth is the most important, but within financials, a half-decade historical view may miss recent interest rate changes and market returns. PNC Financial Services Group’s recent performance shows its demand has slowed as its revenue was flat over the last two years. 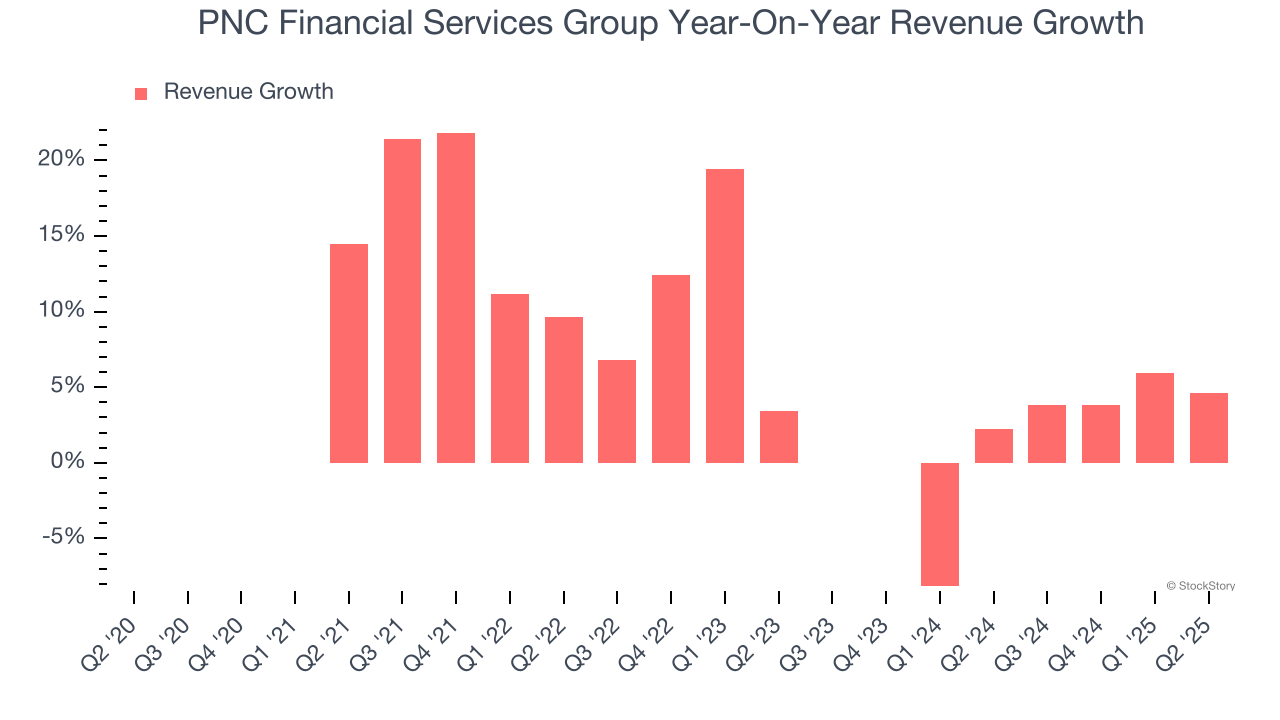 Note: Quarters not shown were determined to be outliers, impacted by outsized investment gains/losses that are not indicative of the recurring fundamentals of the business.
This quarter, PNC Financial Services Group reported modest year-on-year revenue growth of 4.6% but beat Wall Street’s estimates by 1.3%.
Net interest income made up 61% of the company’s total revenue during the last five years, meaning lending operations are PNC Financial Services Group’s largest source of revenue.
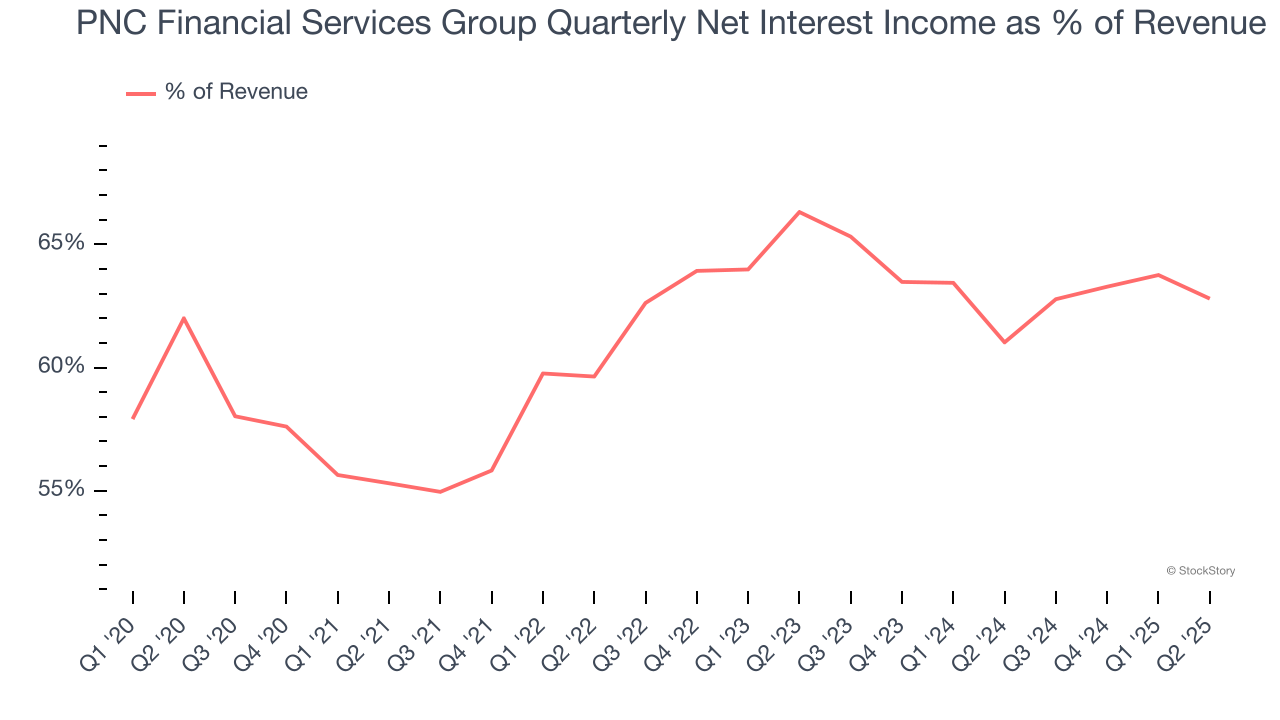
Markets consistently prioritize net interest income growth over fee-based revenue, recognizing its superior quality and recurring nature compared to the more unpredictable non-interest income streams.
Today’s young investors won’t have read the timeless lessons in Gorilla Game: Picking Winners In High Technology because it was written more than 20 years ago when Microsoft and Apple were first establishing their supremacy. But if we apply the same principles, then enterprise software stocks leveraging their own generative AI capabilities may well be the Gorillas of the future. So, in that spirit, we are excited to present our Special Free Report on a profitable, fast-growing enterprise software stock that is already riding the automation wave and looking to catch the generative AI next.
Tangible Book Value Per Share (TBVPS)
Banks profit by intermediating between depositors and borrowers, making them fundamentally balance sheet-driven enterprises. Market participants emphasize balance sheet quality and sustained book value growth when evaluating these institutions.
This explains why tangible book value per share (TBVPS) stands as the premier banking metric. TBVPS strips away questionable intangible assets, revealing concrete per-share net worth that investors can trust. Other (and more commonly known) per-share metrics like EPS can sometimes be murky due to M&A or accounting rules allowing for loan losses to be spread out.
PNC Financial Services Group’s TBVPS grew at a sluggish 2.2% annual clip over the last five years. However, TBVPS growth has accelerated recently, growing by 15.4% annually over the last two years from $78.13 to $103.96 per share.
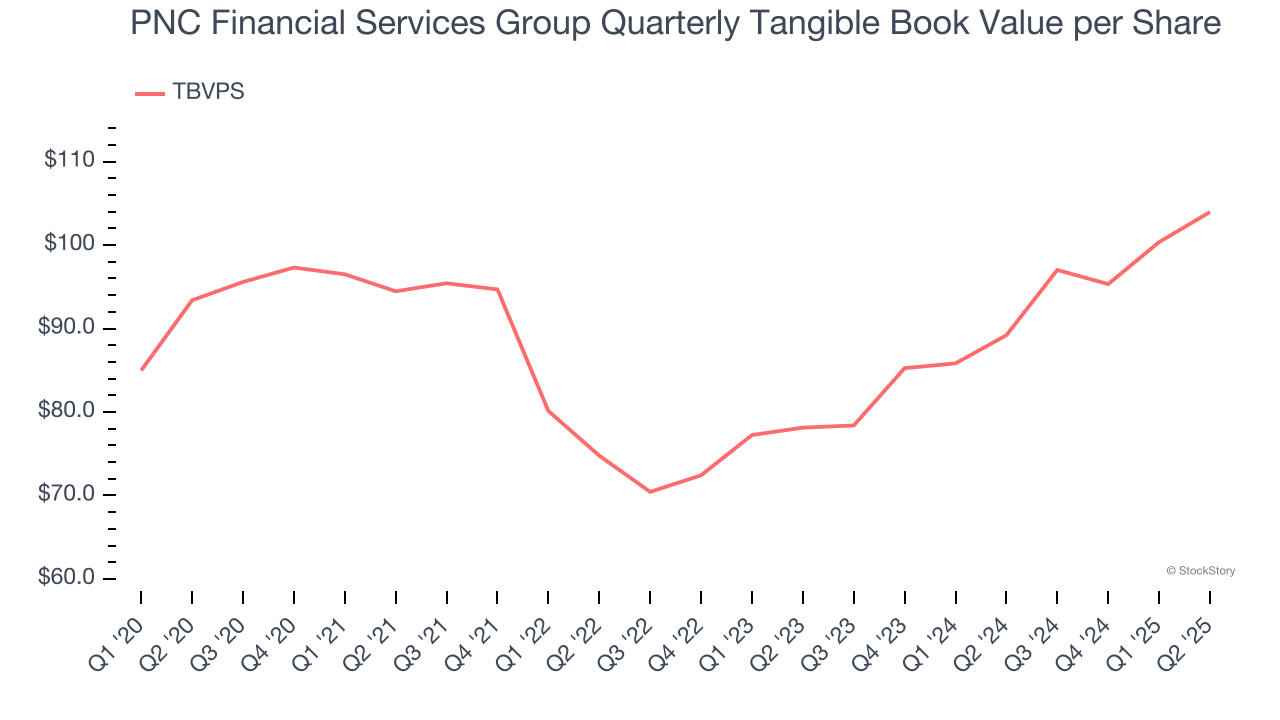
Over the next 12 months, Consensus estimates call for PNC Financial Services Group’s TBVPS to grow by 8% to $112.23, decent growth rate.
Key Takeaways from PNC Financial Services Group’s Q2 Results
It was good to see PNC Financial Services Group narrowly top analysts’ tangible book value per share expectations this quarter. We were also happy its revenue narrowly outperformed Wall Street’s estimates. Overall, this print had some key positives. The stock traded up 1.5% to $195 immediately following the results.
So do we think PNC Financial Services Group is an attractive buy at the current price? What happened in the latest quarter matters, but not as much as longer-term business quality and valuation, when deciding whether to invest in this stock. We cover that in our actionable full research report which you can read here, it’s free.