
Regional banking company First Merchants (NASDAQ: FRME) missed Wall Street’s revenue expectations in Q2 CY2025 as sales rose 2.8% year on year to $164.3 million. Its non-GAAP profit of $0.98 per share was 3.7% above analysts’ consensus estimates.
Is now the time to buy First Merchants? Find out by accessing our full research report, it’s free.
First Merchants (FRME) Q2 CY2025 Highlights:
- Net Interest Income: $133 million vs analyst estimates of $139.1 million (3.5% year-on-year growth, 4.4% miss)
- Net Interest Margin: 3.3% vs analyst estimates of 3.3% (9 basis point year-on-year increase, in line)
- Revenue: $164.3 million vs analyst estimates of $165.8 million (2.8% year-on-year growth, 0.9% miss)
- Efficiency Ratio: 54% vs analyst estimates of 54.6% (0.6 percentage point beat)
- Adjusted EPS: $0.98 vs analyst estimates of $0.95 (3.7% beat)
- Market Capitalization: $2.42 billion
"Our strong balance sheet and earnings growth in the first half of the year underscore the strength and resilience of our business model," said Mark Hardwick, Chief Executive Officer of First Merchants Bank.
Company Overview
Dating back to 1893 when it first opened its doors in Indiana, First Merchants (NASDAQ: FRME) is a Midwest regional bank providing commercial, consumer, and wealth management services through branches in Indiana, Ohio, Michigan, and Illinois.
Sales Growth
Two primary revenue streams drive bank earnings. While net interest income, which is earned by charging higher rates on loans than paid on deposits, forms the foundation, fee-based services across banking, credit, wealth management, and trading operations provide additional income.
Over the last five years, First Merchants grew its revenue at a decent 6.9% compounded annual growth rate. Its growth was slightly above the average bank company and shows its offerings resonate with customers.
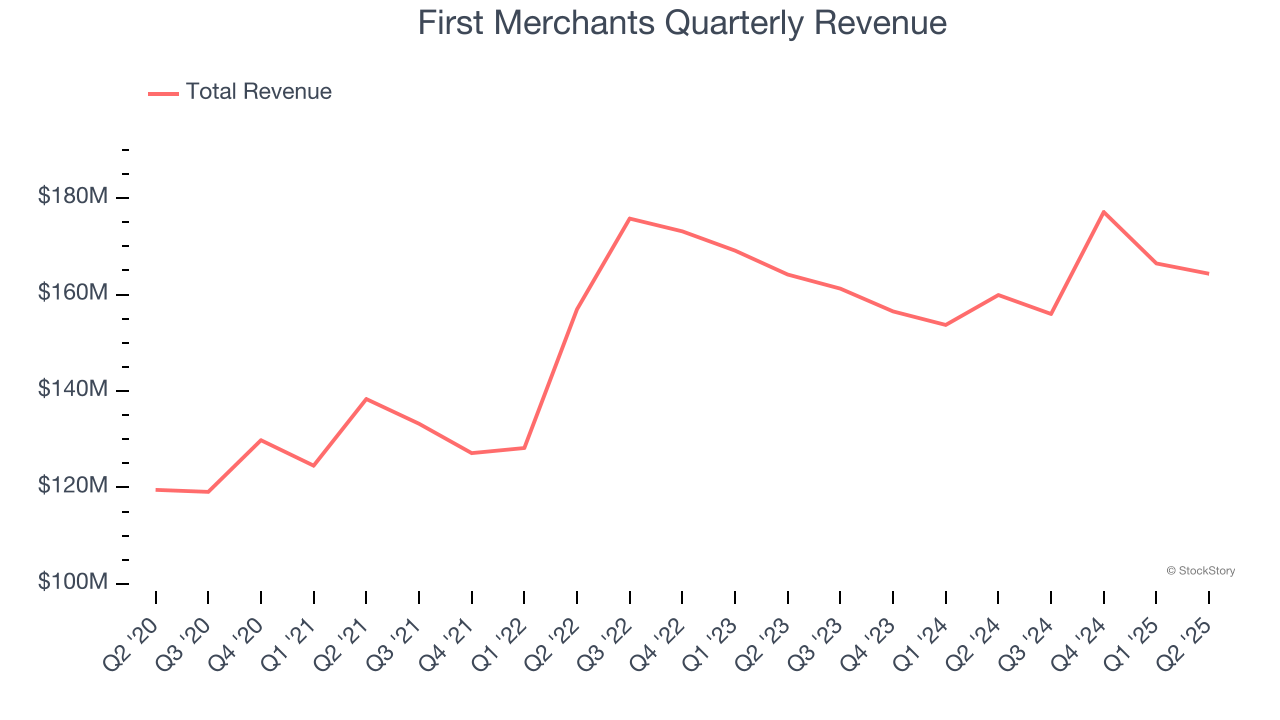
Long-term growth is the most important, but within financials, a half-decade historical view may miss recent interest rate changes and market returns. First Merchants’s recent performance marks a sharp pivot from its five-year trend as its revenue has shown annualized declines of 1.3% over the last two years. 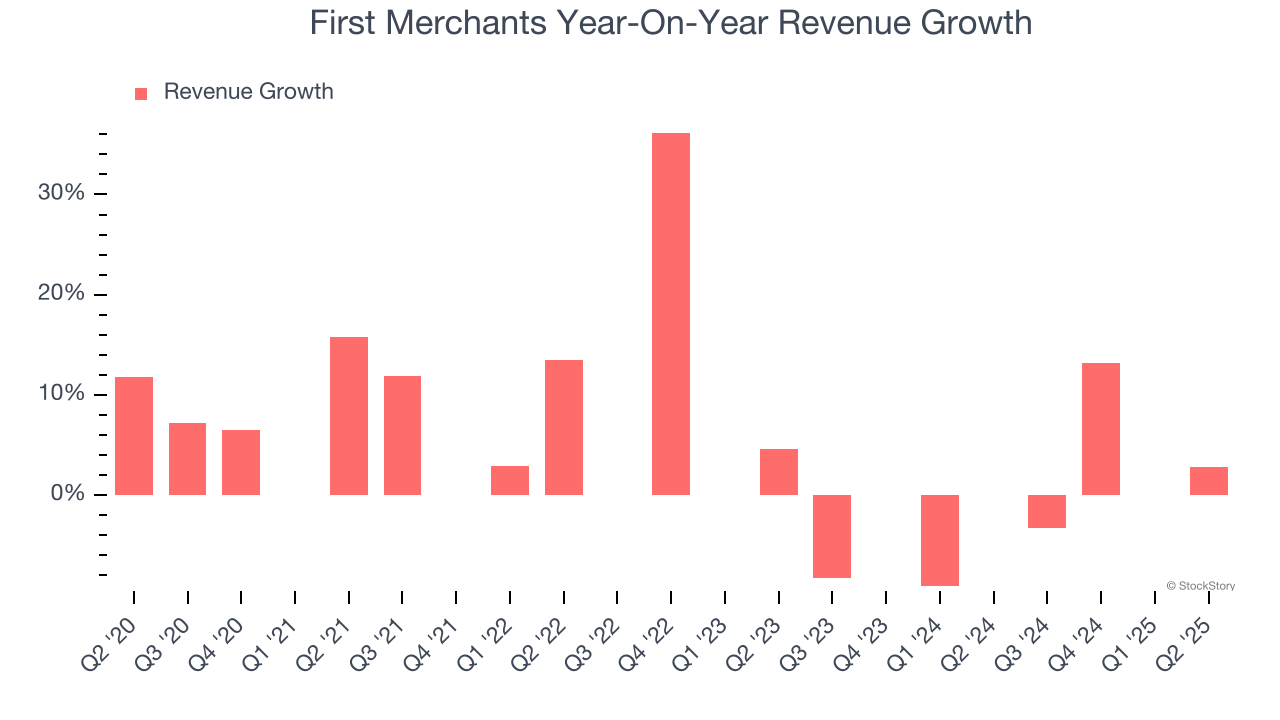 Note: Quarters not shown were determined to be outliers, impacted by outsized investment gains/losses that are not indicative of the recurring fundamentals of the business.
This quarter, First Merchants’s revenue grew by 2.8% year on year to $164.3 million, falling short of Wall Street’s estimates.
Net interest income made up 80.8% of the company’s total revenue during the last five years, meaning First Merchants barely relies on non-interest income to drive its overall growth.
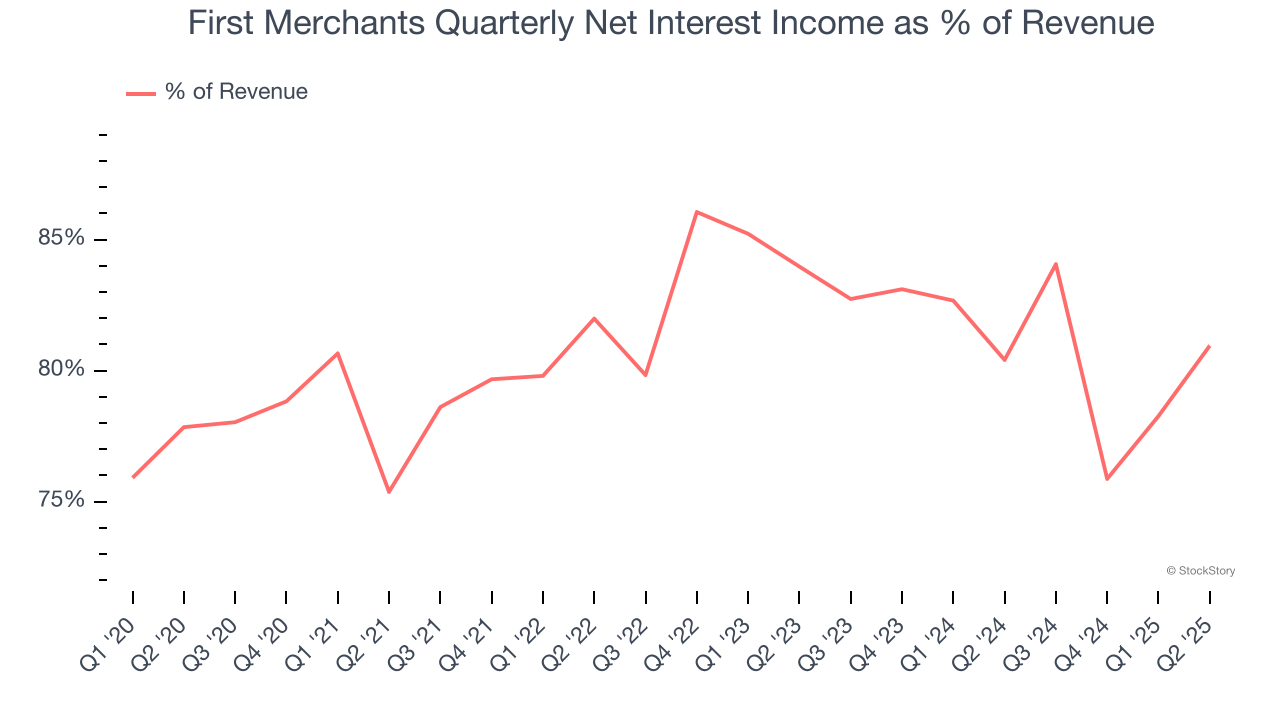
Net interest income commands greater market attention due to its reliability and consistency, whereas non-interest income is often seen as lower-quality revenue that lacks the same dependable characteristics.
Unless you’ve been living under a rock, it should be obvious by now that generative AI is going to have a huge impact on how large corporations do business. While Nvidia and AMD are trading close to all-time highs, we prefer a lesser-known (but still profitable) stock benefiting from the rise of AI. Click here to access our free report one of our favorites growth stories.
Tangible Book Value Per Share (TBVPS)
Banks operate as balance sheet businesses, with profits generated through borrowing and lending activities. Valuations reflect this reality, emphasizing balance sheet strength and long-term book value compounding ability.
Because of this, tangible book value per share (TBVPS) emerges as the critical performance benchmark. By excluding intangible assets with uncertain liquidation values, this metric captures real, liquid net worth per share. On the other hand, EPS is often distorted by mergers and flexible loan loss accounting. TBVPS provides clearer performance insights.
First Merchants’s TBVPS grew at a mediocre 4% annual clip over the last five years. However, TBVPS growth has accelerated recently, growing by 9.6% annually over the last two years from $23.22 to $27.90 per share.
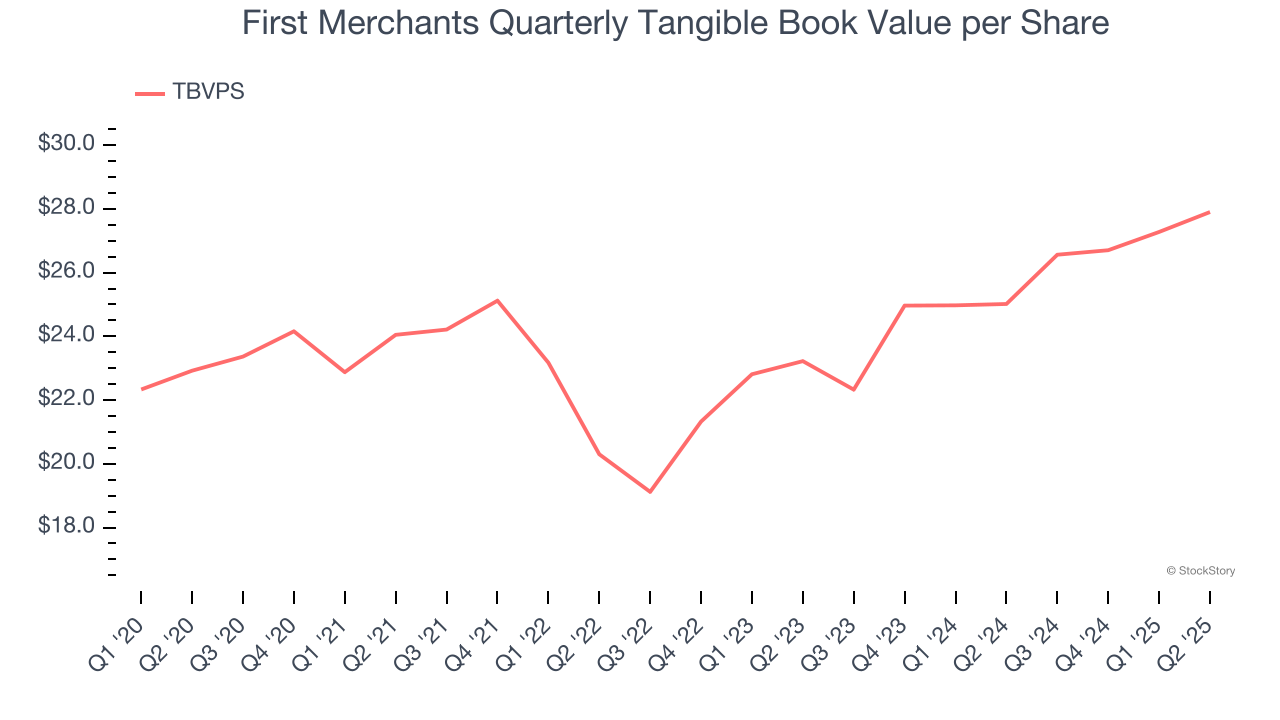
Over the next 12 months, Consensus estimates call for First Merchants’s TBVPS to grow by 10.3% to $30.76, solid growth rate.
Key Takeaways from First Merchants’s Q2 Results
It was good to see EPS beat, but its net interest income and revenue fell short of Wall Street’s estimates. Overall, this quarter could have been better. The stock traded up 1.6% to $42 immediately following the results.
Is First Merchants an attractive investment opportunity at the current price? We think that the latest quarter is only one piece of the longer-term business quality puzzle. Quality, when combined with valuation, can help determine if the stock is a buy. We cover that in our actionable full research report which you can read here, it’s free.


