
Florida regional bank Seacoast Banking (NASDAQ: SBCF) reported Q2 CY2025 results topping the market’s revenue expectations, with sales up 19.6% year on year to $151.4 million. Its non-GAAP profit of $0.52 per share was 22.8% above analysts’ consensus estimates.
Is now the time to buy Seacoast Banking? Find out by accessing our full research report, it’s free.
Seacoast Banking (SBCF) Q2 CY2025 Highlights:
- Net Interest Income: $126.9 million vs analyst estimates of $123 million (21.5% year-on-year growth, 3.1% beat)
- Net Interest Margin: 3.6% vs analyst estimates of 3.5% (40 basis point year-on-year increase, 8.7 bps beat)
- Revenue: $151.4 million vs analyst estimates of $144.2 million (19.6% year-on-year growth, 5% beat)
- Efficiency Ratio: 57% vs analyst estimates of 61.3% (4.4 percentage point beat)
- Adjusted EPS: $0.52 vs analyst estimates of $0.42 (22.8% beat)
- Market Capitalization: $2.46 billion
Charles M. Shaffer, Seacoast's Chairman and CEO, said, “Our performance in the second quarter showcases the strength and momentum of our franchise. The expansion in net interest margin is a direct result of the disciplined execution and strategic focus of the Seacoast team. We’re seeing the benefits of consistent, high-quality loan growth and well-managed deposit costs, which are fueling strong net interest income growth. Our fee-based revenue businesses continue to expand and expenses are well controlled.”
Company Overview
Founded during the Florida land boom of 1926 and surviving the Great Depression, Seacoast Banking Corporation of Florida (NASDAQ: SBCF) is a financial holding company that provides commercial and retail banking, wealth management, and mortgage services throughout Florida.
Sales Growth
Two primary revenue streams drive bank earnings. While net interest income, which is earned by charging higher rates on loans than paid on deposits, forms the foundation, fee-based services across banking, credit, wealth management, and trading operations provide additional income.
Thankfully, Seacoast Banking’s 12.1% annualized revenue growth over the last five years was excellent. Its growth beat the average bank company and shows its offerings resonate with customers.
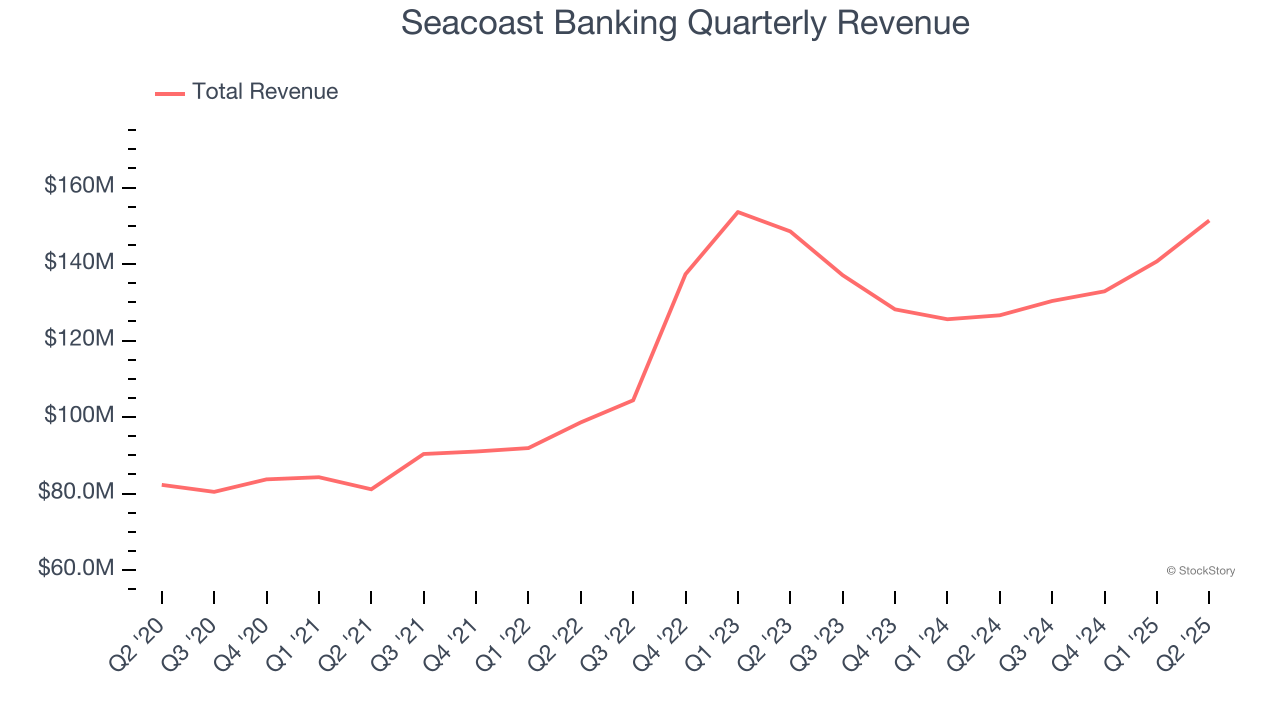
We at StockStory place the most emphasis on long-term growth, but within financials, a half-decade historical view may miss recent interest rate changes, market returns, and industry trends. Seacoast Banking’s recent performance shows its demand has slowed significantly as its annualized revenue growth of 1% over the last two years was well below its five-year trend. 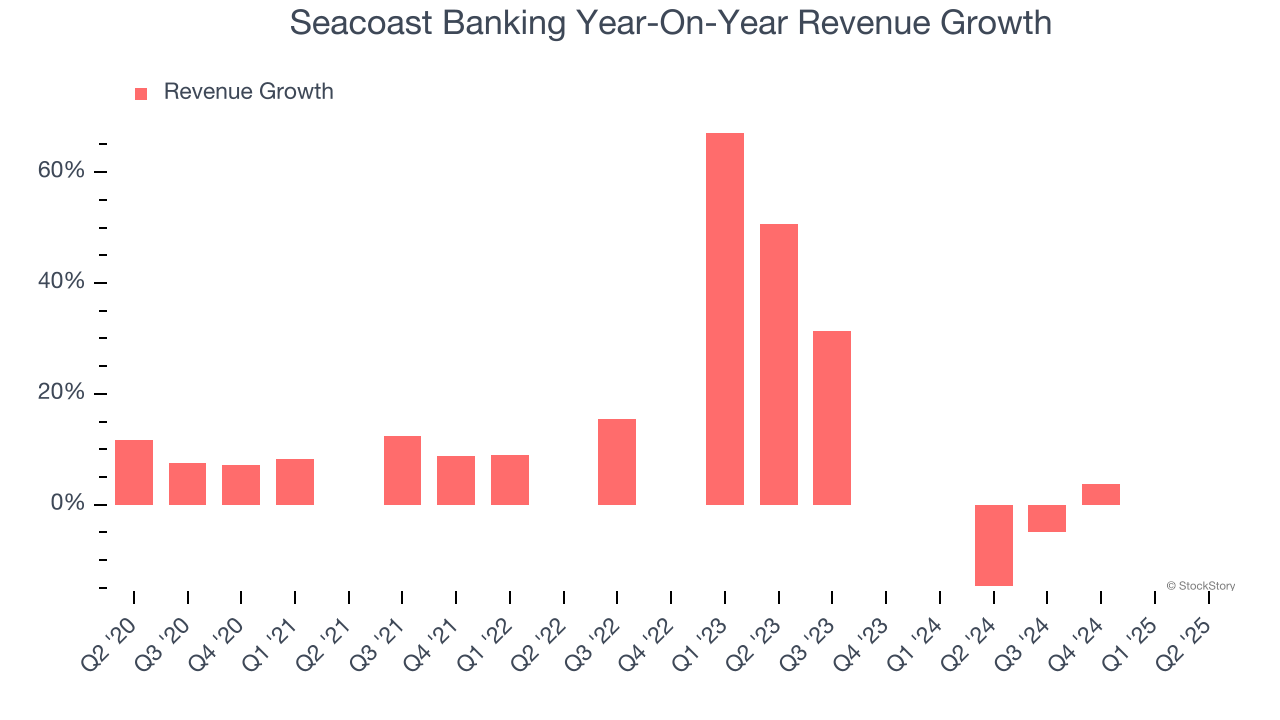 Note: Quarters not shown were determined to be outliers, impacted by outsized investment gains/losses that are not indicative of the recurring fundamentals of the business.
This quarter, Seacoast Banking reported year-on-year revenue growth of 19.6%, and its $151.4 million of revenue exceeded Wall Street’s estimates by 5%.
Net interest income made up 83.2% of the company’s total revenue during the last five years, meaning Seacoast Banking barely relies on non-interest income to drive its overall growth.
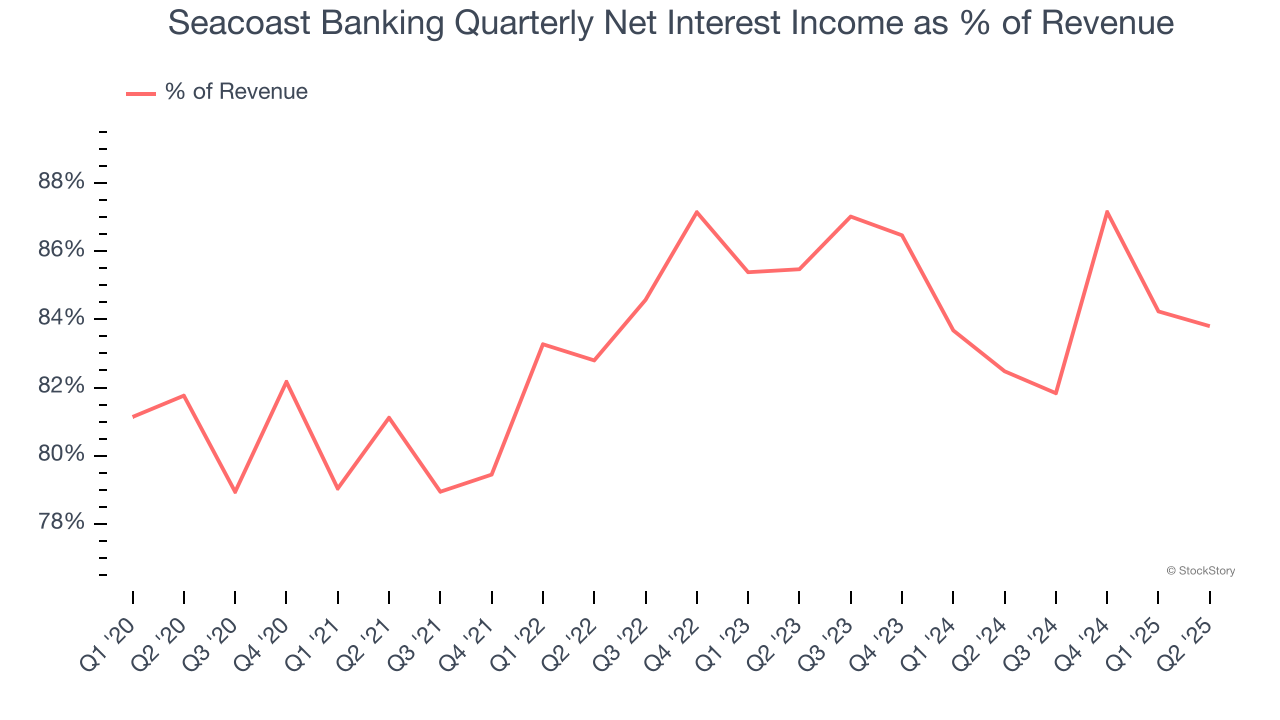
Markets consistently prioritize net interest income growth over fee-based revenue, recognizing its superior quality and recurring nature compared to the more unpredictable non-interest income streams.
Software is eating the world and there is virtually no industry left that has been untouched by it. That drives increasing demand for tools helping software developers do their jobs, whether it be monitoring critical cloud infrastructure, integrating audio and video functionality, or ensuring smooth content streaming. Click here to access a free report on our 3 favorite stocks to play this generational megatrend.
Tangible Book Value Per Share (TBVPS)
Banks profit by intermediating between depositors and borrowers, making them fundamentally balance sheet-driven enterprises. Market participants emphasize balance sheet quality and sustained book value growth when evaluating these institutions.
This is why we consider tangible book value per share (TBVPS) the most important metric to track for banks. TBVPS represents the real, liquid net worth per share of a bank, excluding intangible assets that have debatable value upon liquidation. EPS can become murky due to acquisition impacts or accounting flexibility around loan provisions, and TBVPS resists financial engineering manipulation.
Seacoast Banking’s TBVPS grew at a sluggish 2.5% annual clip over the last five years. However, TBVPS growth has accelerated recently, growing by 9.5% annually over the last two years from $14.33 to $17.19 per share.
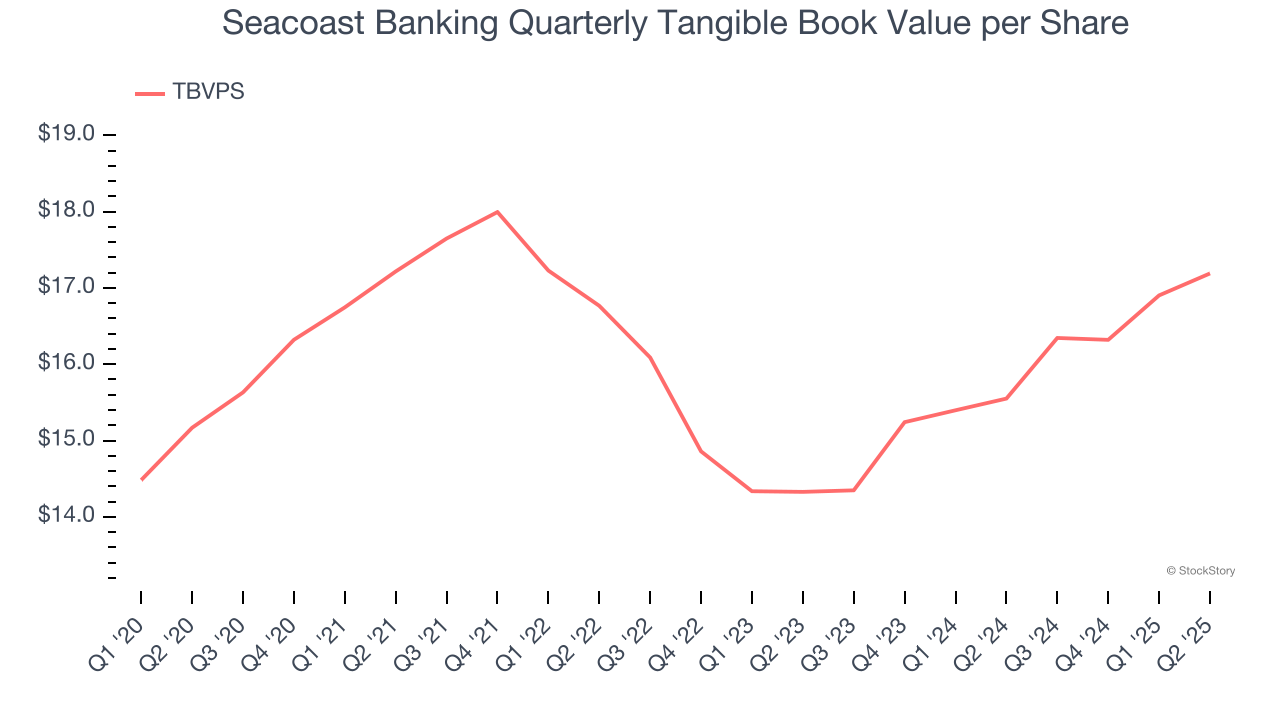
Over the next 12 months, Consensus estimates call for Seacoast Banking’s TBVPS to shrink by 5.8% to $16.20, a sour projection.
Key Takeaways from Seacoast Banking’s Q2 Results
We were impressed by how Seacoast Banking beat analysts’ expectations across the board this quarter. Zooming out, we think this was a solid print. The stock remained flat at $28.81 immediately after reporting.
Is Seacoast Banking an attractive investment opportunity right now? We think that the latest quarter is only one piece of the longer-term business quality puzzle. Quality, when combined with valuation, can help determine if the stock is a buy. We cover that in our actionable full research report which you can read here, it’s free.