
OLED provider Universal Display (NASDAQ: OLED) reported Q2 CY2025 results topping the market’s revenue expectations, with sales up 8.4% year on year to $171.8 million. The company’s full-year revenue guidance of $675 million at the midpoint came in 0.7% above analysts’ estimates. Its GAAP profit of $1.41 per share was 21.2% above analysts’ consensus estimates.
Is now the time to buy Universal Display? Find out by accessing our full research report, it’s free.
Universal Display (OLED) Q2 CY2025 Highlights:
- Revenue: $171.8 million vs analyst estimates of $161.9 million (8.4% year-on-year growth, 6.1% beat)
- EPS (GAAP): $1.41 vs analyst estimates of $1.16 (21.2% beat)
- The company slightly lifted its revenue guidance for the full year to $675 million at the midpoint from $670 million
- Operating Margin: 39.9%, up from 35.6% in the same quarter last year
- Free Cash Flow Margin: 21.8%, down from 36.5% in the same quarter last year
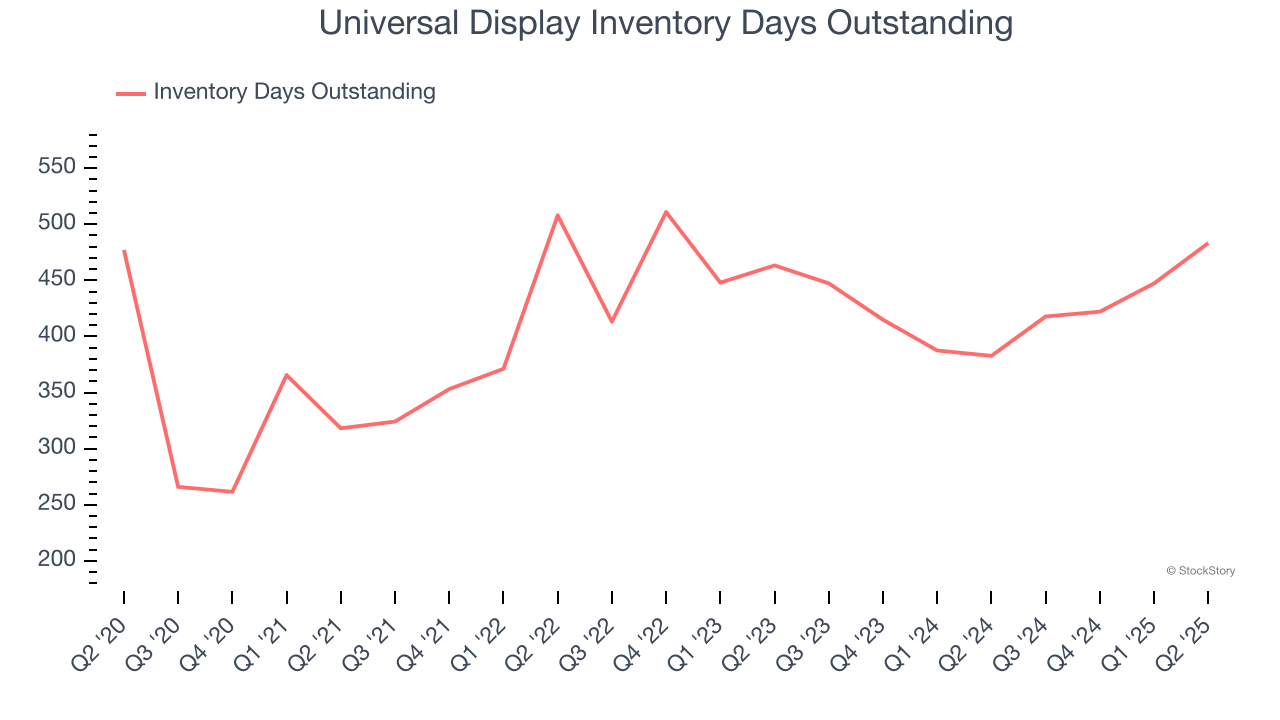
- Inventory Days Outstanding: 483, up from 447 in the previous quarter
- Market Capitalization: $6.96 billion
Company Overview
Serving major consumer electronics manufacturers, Universal Display (NASDAQ: OLED) is a provider of organic light emitting diode (OLED) technologies used in display and lighting applications.
Revenue Growth
Reviewing a company’s long-term sales performance reveals insights into its quality. Any business can put up a good quarter or two, but the best consistently grow over the long haul. Thankfully, Universal Display’s 12.4% annualized revenue growth over the last five years was solid. Its growth beat the average semiconductor company and shows its offerings resonate with customers. Semiconductors are a cyclical industry, and long-term investors should be prepared for periods of high growth followed by periods of revenue contractions.
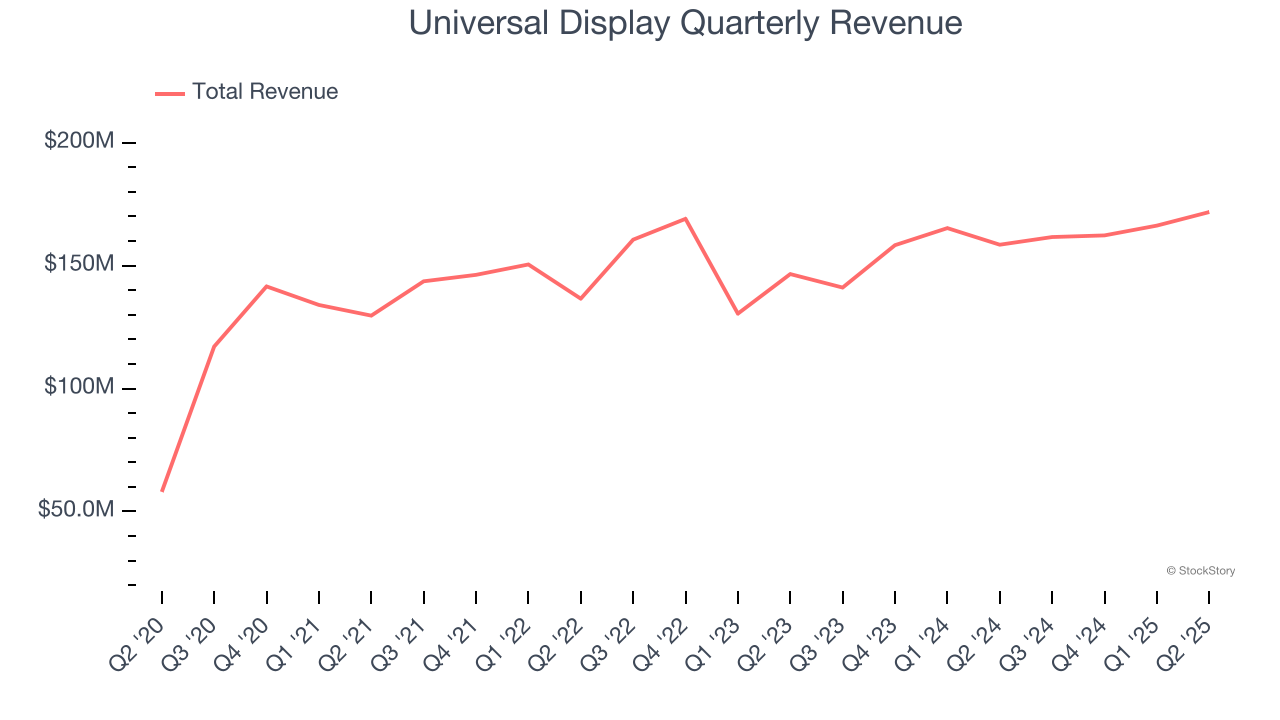
We at StockStory place the most emphasis on long-term growth, but within semiconductors, a half-decade historical view may miss new demand cycles or industry trends like AI. Universal Display’s recent performance shows its demand has slowed as its annualized revenue growth of 4.5% over the last two years was below its five-year trend. 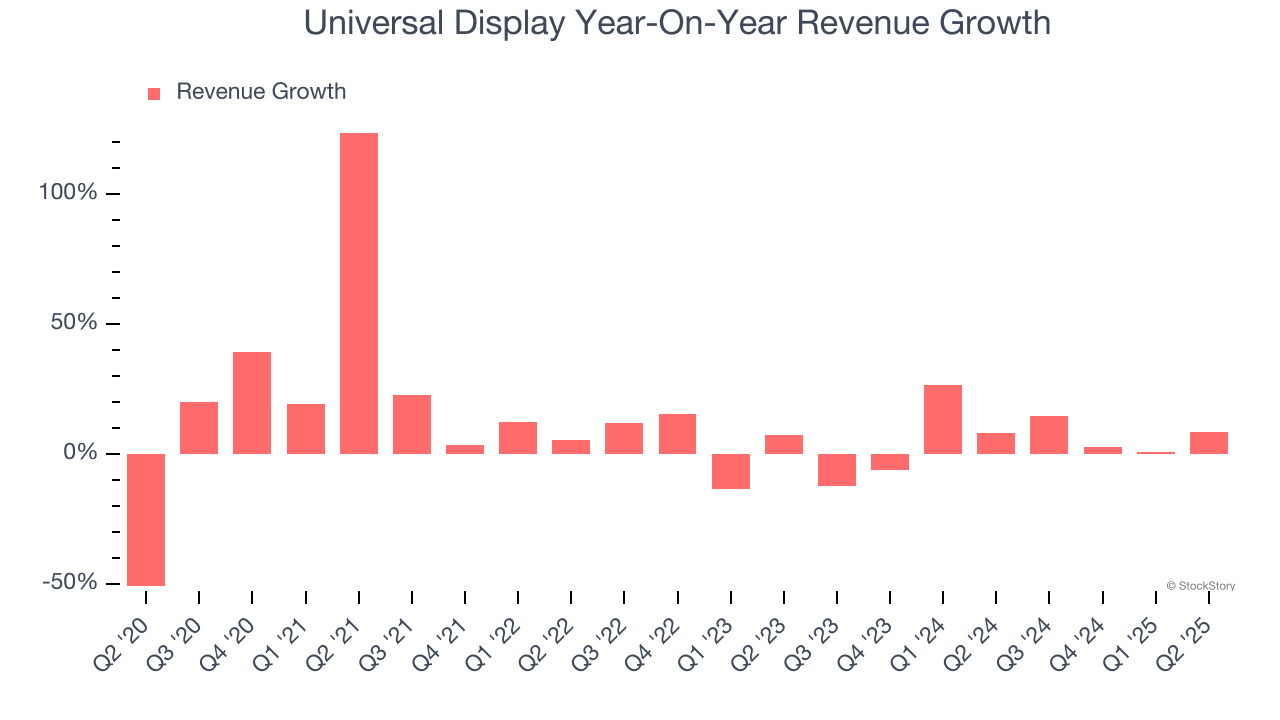
This quarter, Universal Display reported year-on-year revenue growth of 8.4%, and its $171.8 million of revenue exceeded Wall Street’s estimates by 6.1%. Beyond the beat, this marks 6 straight quarters of growth, showing that the current upcycle has had a good run - a typical upcycle usually lasts 8-10 quarters.
Looking ahead, sell-side analysts expect revenue to grow 4.1% over the next 12 months, similar to its two-year rate. This projection is underwhelming and indicates its newer products and services will not lead to better top-line performance yet.
Here at StockStory, we certainly understand the potential of thematic investing. Diverse winners from Microsoft (MSFT) to Alphabet (GOOG), Coca-Cola (KO) to Monster Beverage (MNST) could all have been identified as promising growth stories with a megatrend driving the growth. So, in that spirit, we’ve identified a relatively under-the-radar profitable growth stock benefiting from the rise of AI, available to you FREE via this link.
Product Demand & Outstanding Inventory
Days Inventory Outstanding (DIO) is an important metric for chipmakers, as it reflects a business’ capital intensity and the cyclical nature of semiconductor supply and demand. In a tight supply environment, inventories tend to be stable, allowing chipmakers to exert pricing power. Steadily increasing DIO can be a warning sign that demand is weak, and if inventories continue to rise, the company may have to downsize production.
This quarter, Universal Display’s DIO came in at 483, which is 83 days above its five-year average, suggesting that the company’s inventory has grown to higher levels than we’ve seen in the past.
Key Takeaways from Universal Display’s Q2 Results
We were impressed by how significantly Universal Display blew past analysts’ EPS expectations this quarter. We were also glad its revenue outperformed Wall Street’s estimates. On the other hand, its inventory levels materially increased. Overall, we think this was still a solid quarter with some key areas of upside. The stock traded up 3.3% to $149.50 immediately after reporting.
Universal Display put up rock-solid earnings, but one quarter doesn’t necessarily make the stock a buy. Let’s see if this is a good investment. We think that the latest quarter is only one piece of the longer-term business quality puzzle. Quality, when combined with valuation, can help determine if the stock is a buy. We cover that in our actionable full research report which you can read here, it’s free.


