Financial and compliance reporting software company Workiva (NYSE: WK) beat Wall Street’s revenue expectations in Q2 CY2025, with sales up 21.2% year on year to $215.2 million. The company expects next quarter’s revenue to be around $219 million, close to analysts’ estimates. Its non-GAAP profit of $0.19 per share was significantly above analysts’ consensus estimates.
Is now the time to buy Workiva? Find out by accessing our full research report, it’s free.
Workiva (WK) Q2 CY2025 Highlights:
- Revenue: $215.2 million vs analyst estimates of $208.9 million (21.2% year-on-year growth, 3% beat)
- Adjusted EPS: $0.19 vs analyst estimates of $0.05 (significant beat)
- Adjusted Operating Income: $8.23 million vs analyst estimates of $549,430 (3.8% margin, significant beat)
- The company slightly lifted its revenue guidance for the full year to $871.5 million at the midpoint from $866 million
- Management raised its full-year Adjusted EPS guidance to $1.35 at the midpoint, a 27.5% increase
- Operating Margin: -10.3%, up from -13% in the same quarter last year
- Free Cash Flow was $49.32 million, up from -$8.12 million in the previous quarter
- Customers: 6,467, up from 6,385 in the previous quarter
- Net Revenue Retention Rate: 114%, up from 110% in the previous quarter
- Billings: $230.6 million at quarter end, up 20.6% year on year
- Market Capitalization: $3.71 billion
Company Overview
Founded in 2010, Workiva (NYSE: WK) offers software as a service product that makes financial and compliance reporting easier, especially for publicly traded corporations.
Revenue Growth
A company’s long-term performance is an indicator of its overall quality. Any business can experience short-term success, but top-performing ones enjoy sustained growth for years. Over the last three years, Workiva grew its sales at a 17.7% compounded annual growth rate. Although this growth is acceptable on an absolute basis, it fell slightly short of our standards for the software sector, which enjoys a number of secular tailwinds. Luckily, there are other things to like about Workiva.
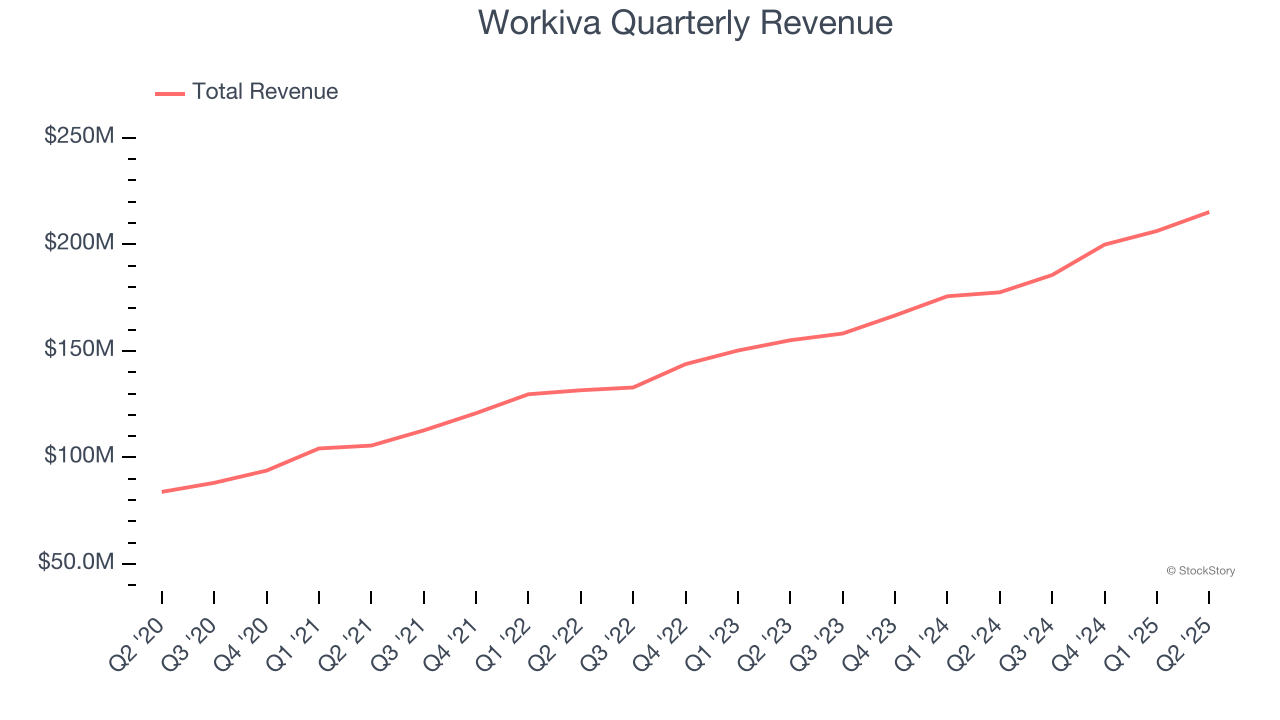
This quarter, Workiva reported robust year-on-year revenue growth of 21.2%, and its $215.2 million of revenue topped Wall Street estimates by 3%. Company management is currently guiding for a 18% year-on-year increase in sales next quarter.
Looking further ahead, sell-side analysts expect revenue to grow 15.6% over the next 12 months, a slight deceleration versus the last three years. Despite the slowdown, this projection is healthy and suggests the market is baking in success for its products and services.
Unless you’ve been living under a rock, it should be obvious by now that generative AI is going to have a huge impact on how large corporations do business. While Nvidia and AMD are trading close to all-time highs, we prefer a lesser-known (but still profitable) stock benefiting from the rise of AI. Click here to access our free report one of our favorites growth stories.
Billings
Billings is a non-GAAP metric that is often called “cash revenue” because it shows how much money the company has collected from customers in a certain period. This is different from revenue, which must be recognized in pieces over the length of a contract.
Workiva’s billings punched in at $230.6 million in Q2, and over the last four quarters, its growth was impressive as it averaged 22.3% year-on-year increases. This alternate topline metric grew faster than total sales, meaning the company collects cash upfront and then recognizes the revenue over the length of its contracts - a boost for its liquidity and future revenue prospects. 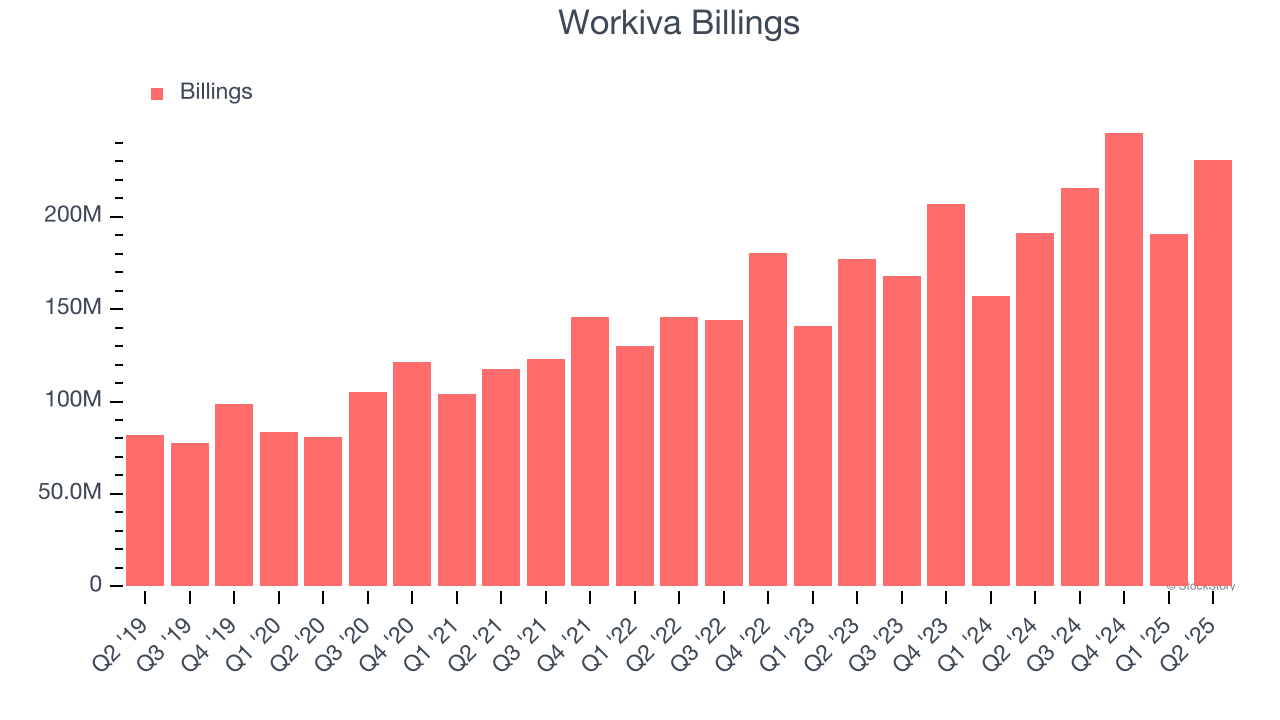
Customer Retention
One of the best parts about the software-as-a-service business model (and a reason why they trade at high valuation multiples) is that customers typically spend more on a company’s products and services over time.
Workiva’s net revenue retention rate, a key performance metric measuring how much money existing customers from a year ago are spending today, was 112% in Q2. This means Workiva would’ve grown its revenue by 11.8% even if it didn’t win any new customers over the last 12 months.
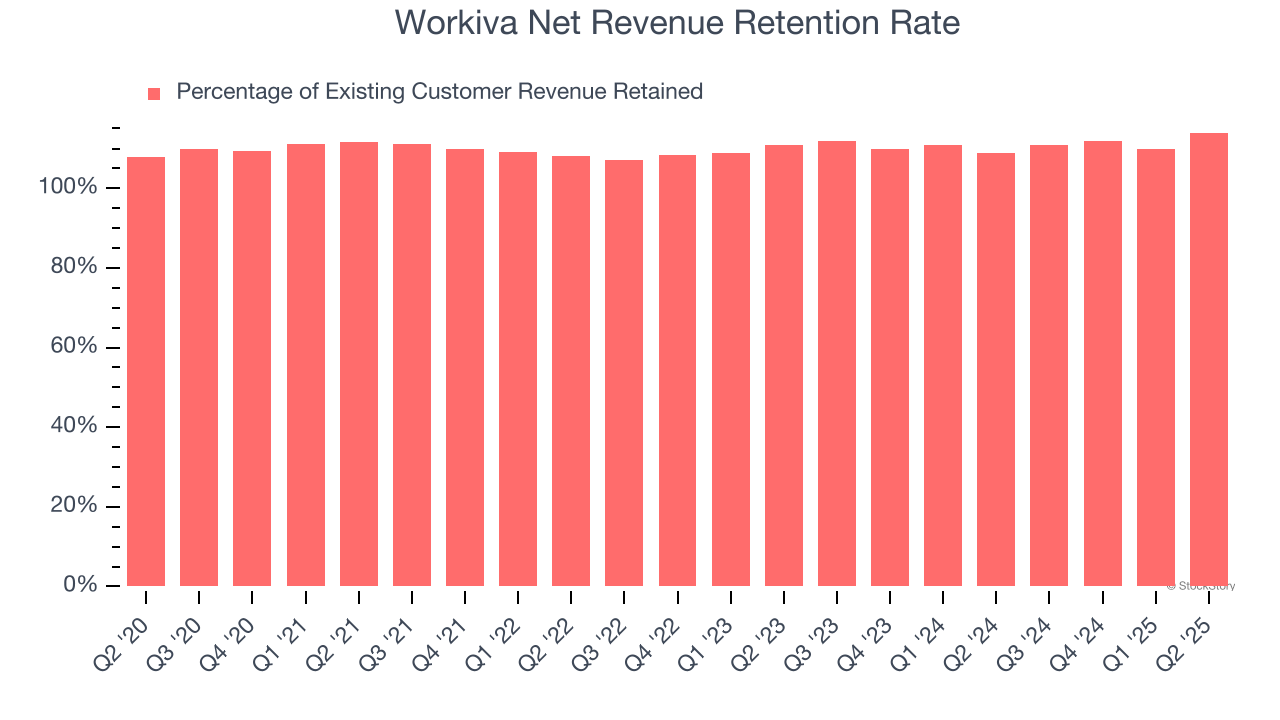
Trending up over the last year, Workiva has a good net retention rate, proving that customers are satisfied with its software and getting more value from it over time, which is always great to see.
Key Takeaways from Workiva’s Q2 Results
We were impressed by how significantly Workiva blew past analysts’ billings expectations this quarter. We were also glad its EPS guidance for next quarter trumped Wall Street’s estimates. Zooming out, we think this was a good print with some key areas of upside. The stock traded up 5.9% to $67.60 immediately after reporting.
Workiva had an encouraging quarter, but one earnings result doesn’t necessarily make the stock a buy. Let’s see if this is a good investment. When making that decision, it’s important to consider its valuation, business qualities, as well as what has happened in the latest quarter. We cover that in our actionable full research report which you can read here, it’s free.