
Wireless telecommunications provider U.S. Cellular (NYSE: USM) beat Wall Street’s revenue expectations in Q2 CY2025, but sales fell by 1.2% year on year to $916 million. Its GAAP profit of $0.36 per share was 7.7% above analysts’ consensus estimates.
Is now the time to buy U.S. Cellular? Find out by accessing our full research report, it’s free.
U.S. Cellular (USM) Q2 CY2025 Highlights:
- Revenue: $916 million vs analyst estimates of $902.6 million (1.2% year-on-year decline, 1.5% beat)
- EPS (GAAP): $0.36 vs analyst estimates of $0.33 (7.7% beat)
- Adjusted EBITDA: $254 million vs analyst estimates of $241.8 million (27.7% margin, 5% beat)
- Operating Margin: 3.8%, in line with the same quarter last year
- Free Cash Flow Margin: 27.3%, up from 19% in the same quarter last year
- Market Capitalization: $6.41 billion
"I am pleased that we have successfully closed the T-Mobile deal and have declared a special dividend in connection with the transaction," said Doug Chambers, Array interim President and CEO.
Company Overview
Operating as a majority-owned subsidiary of Telephone and Data Systems since its founding in 1983, US Cellular (NYSE: USM) is a regional wireless telecommunications provider serving 4.6 million customers across 21 states with mobile phone, internet, and IoT services.
Revenue Growth
A company’s long-term sales performance is one signal of its overall quality. Any business can have short-term success, but a top-tier one grows for years.
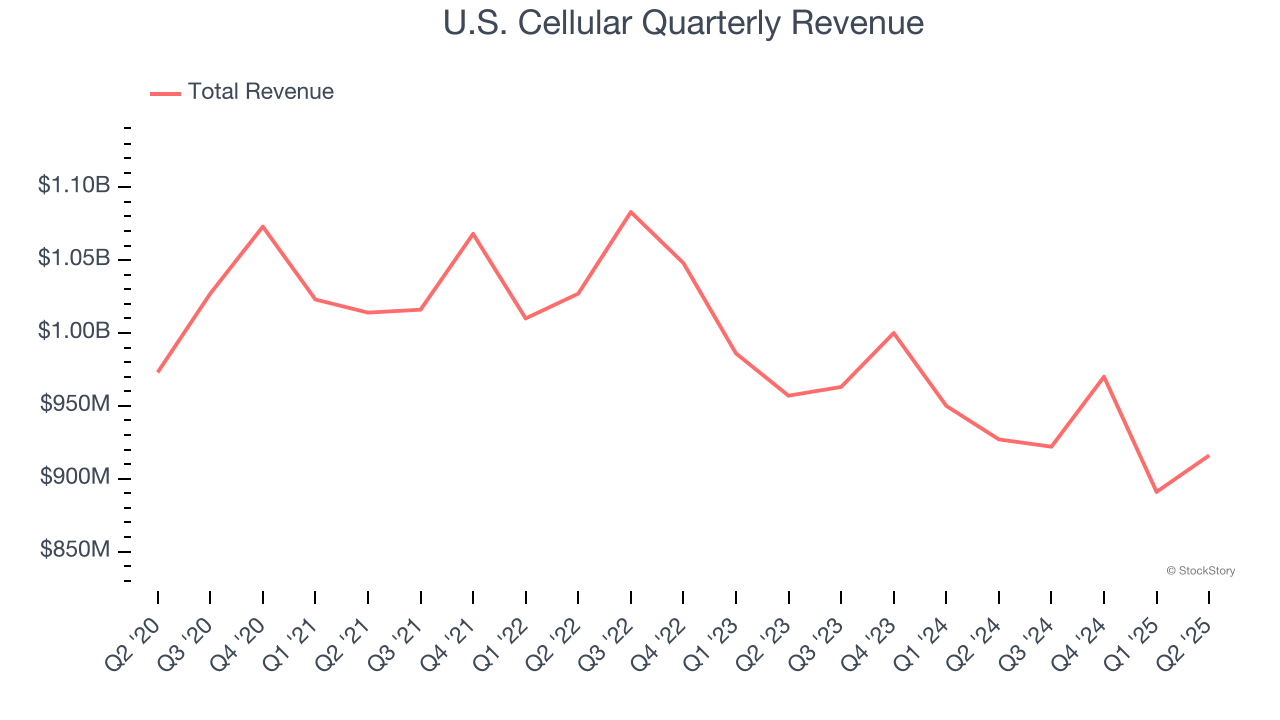
With $3.70 billion in revenue over the past 12 months, U.S. Cellular is a mid-sized business services company, which sometimes brings disadvantages compared to larger competitors benefiting from better economies of scale.
As you can see below, U.S. Cellular’s revenue declined by 1.6% per year over the last five years, a tough starting point for our analysis.
We at StockStory place the most emphasis on long-term growth, but within business services, a half-decade historical view may miss recent innovations or disruptive industry trends. U.S. Cellular’s recent performance shows its demand remained suppressed as its revenue has declined by 4.7% annually over the last two years. 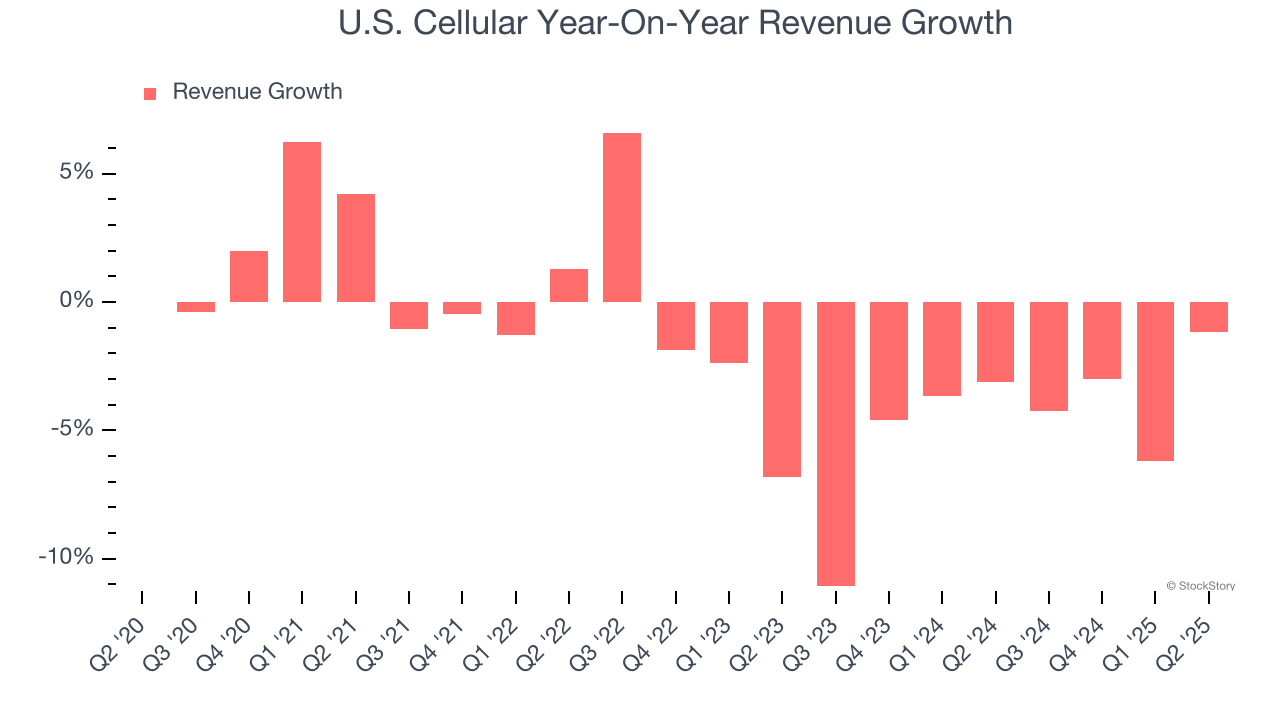
We can dig further into the company’s revenue dynamics by analyzing its most important segment, Services revenue. Over the last two years, U.S. Cellular’s Services revenue revenue (telecom services) averaged 1.9% year-on-year declines. This segment has outperformed its total sales during the same period, lifting the company’s performance. 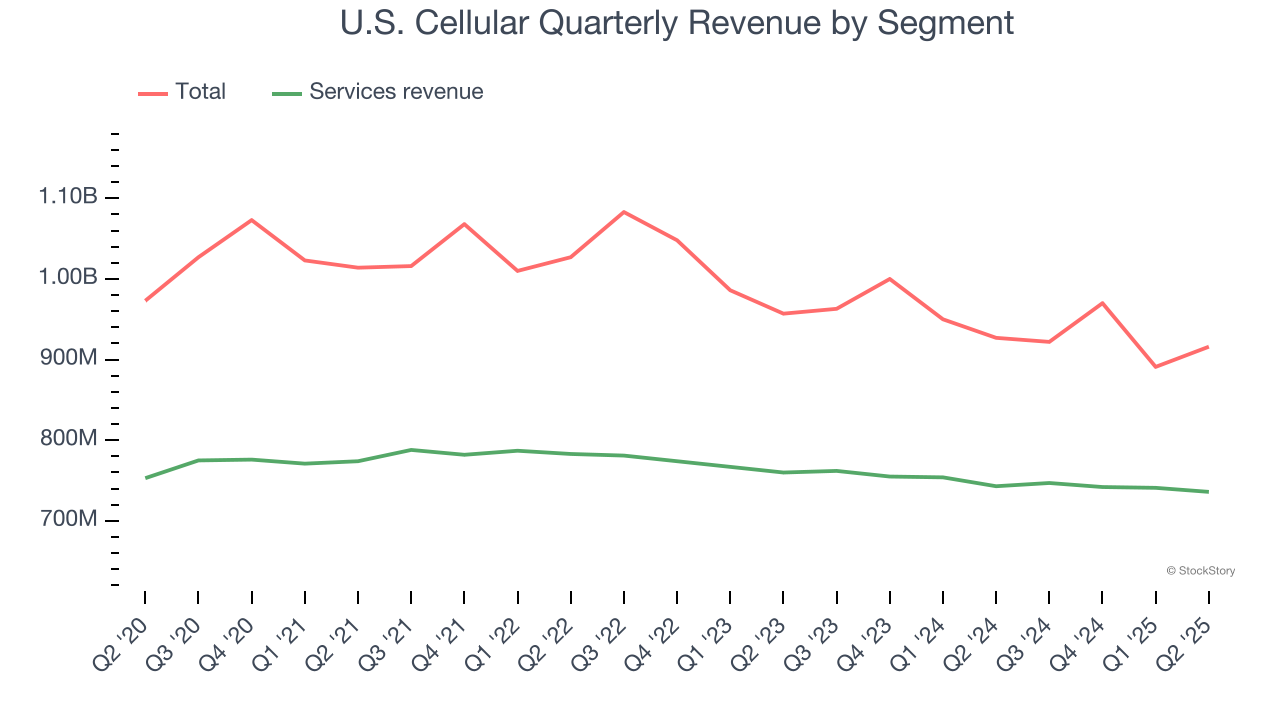
This quarter, U.S. Cellular’s revenue fell by 1.2% year on year to $916 million but beat Wall Street’s estimates by 1.5%.
Looking ahead, sell-side analysts expect revenue to decline by 1.6% over the next 12 months. Although this projection is better than its two-year trend, it’s hard to get excited about a company that is struggling with demand.
Here at StockStory, we certainly understand the potential of thematic investing. Diverse winners from Microsoft (MSFT) to Alphabet (GOOG), Coca-Cola (KO) to Monster Beverage (MNST) could all have been identified as promising growth stories with a megatrend driving the growth. So, in that spirit, we’ve identified a relatively under-the-radar profitable growth stock benefiting from the rise of AI, available to you FREE via this link.
Operating Margin
U.S. Cellular was profitable over the last five years but held back by its large cost base. Its average operating margin of 2.6% was weak for a business services business.
Looking at the trend in its profitability, U.S. Cellular’s operating margin decreased by 5.2 percentage points over the last five years. U.S. Cellular’s performance was poor no matter how you look at it - it shows that costs were rising and it couldn’t pass them onto its customers.
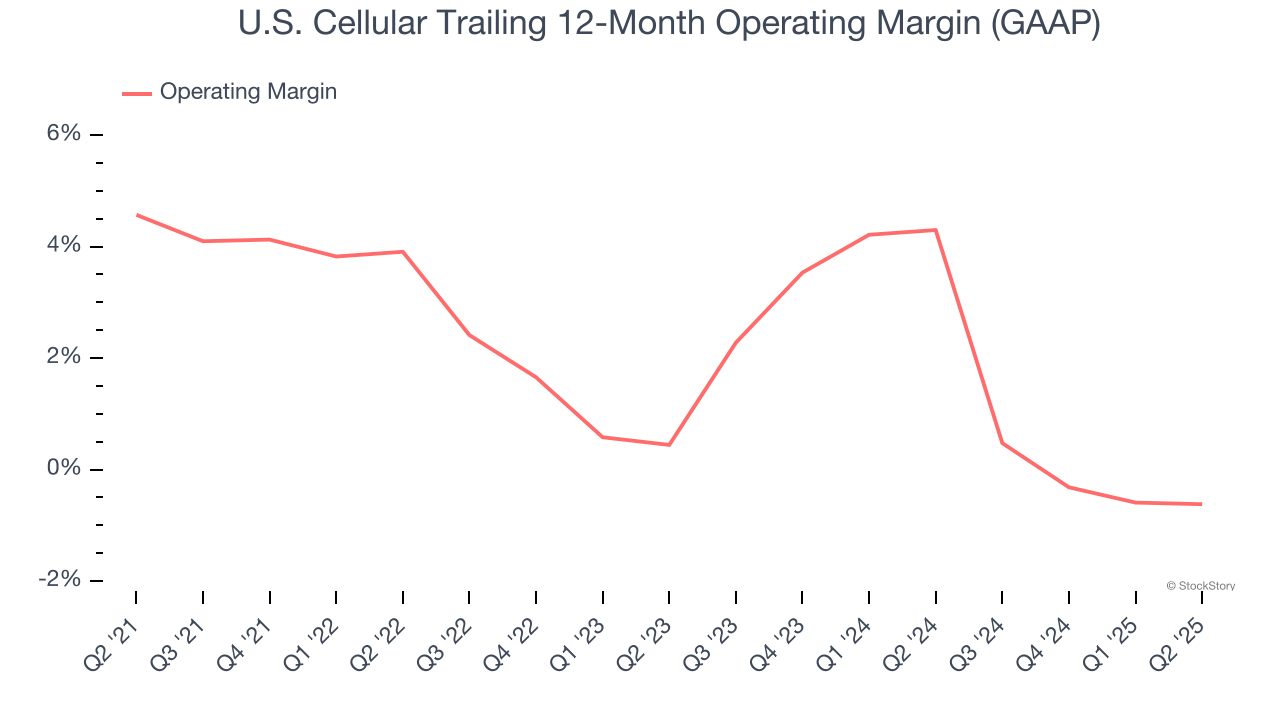
This quarter, U.S. Cellular generated an operating margin profit margin of 3.8%, in line with the same quarter last year. This indicates the company’s overall cost structure has been relatively stable.
Earnings Per Share
We track the long-term change in earnings per share (EPS) for the same reason as long-term revenue growth. Compared to revenue, however, EPS highlights whether a company’s growth is profitable.
Sadly for U.S. Cellular, its EPS declined by 16.5% annually over the last five years, more than its revenue. This tells us the company struggled because its fixed cost base made it difficult to adjust to shrinking demand.
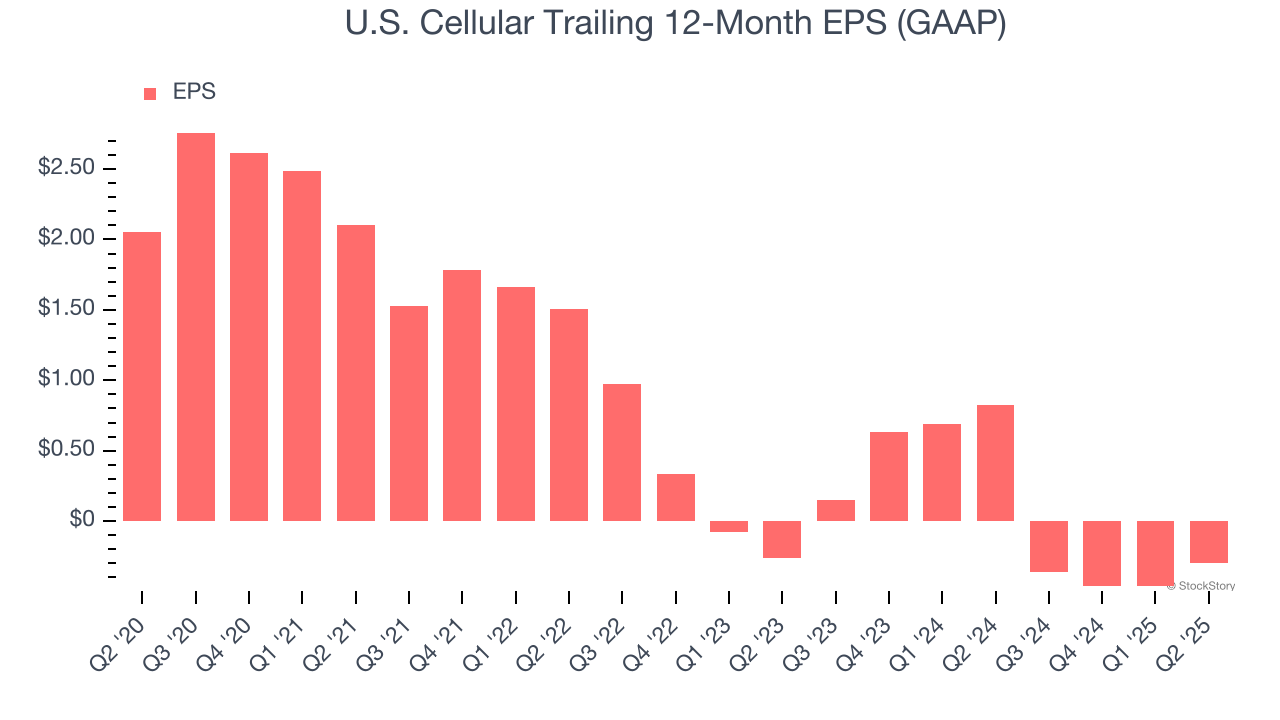
Diving into the nuances of U.S. Cellular’s earnings can give us a better understanding of its performance. As we mentioned earlier, U.S. Cellular’s operating margin was flat this quarter but declined by 5.2 percentage points over the last five years. Its share count also grew by 1.1%, meaning the company not only became less efficient with its operating expenses but also diluted its shareholders. 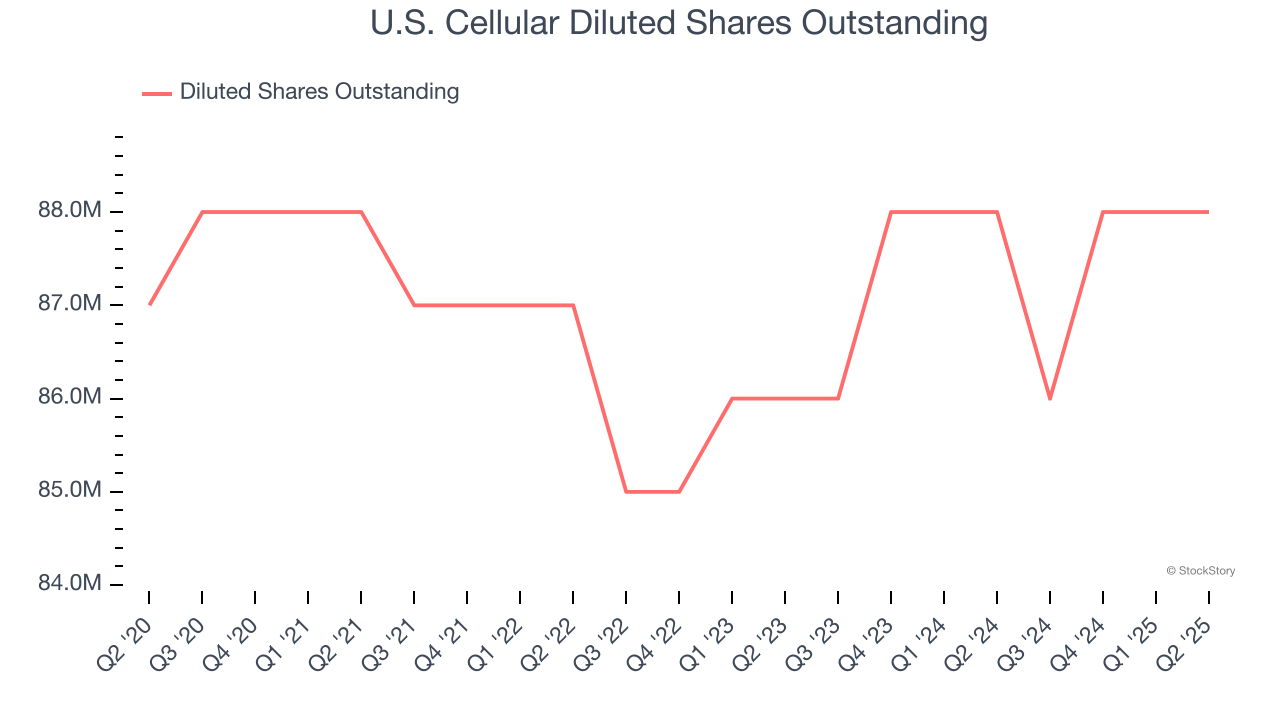
Like with revenue, we analyze EPS over a shorter period to see if we are missing a change in the business.
For U.S. Cellular, its two-year annual EPS declines of 6.7% show it’s still underperforming. These results were bad no matter how you slice the data.
In Q2, U.S. Cellular reported EPS at $0.36, up from $0.19 in the same quarter last year. This print beat analysts’ estimates by 7.7%. Over the next 12 months, Wall Street is optimistic. Analysts forecast U.S. Cellular’s full-year EPS of negative $0.30 will flip to positive $1.10.
Key Takeaways from U.S. Cellular’s Q2 Results
We enjoyed seeing U.S. Cellular beat analysts’ EPS expectations this quarter. We were also happy its revenue narrowly outperformed Wall Street’s estimates. Overall, we think this was a decent quarter with some key metrics above expectations. The stock traded up 4.3% to $77.51 immediately after reporting.
U.S. Cellular may have had a good quarter, but does that mean you should invest right now? The latest quarter does matter, but not nearly as much as longer-term fundamentals and valuation, when deciding if the stock is a buy. We cover that in our actionable full research report which you can read here, it’s free.


