
As the Q2 earnings season wraps, let’s dig into this quarter’s best and worst performers in the sit-down dining industry, including Bloomin' Brands (NASDAQ: BLMN) and its peers.
Sit-down restaurants offer a complete dining experience with table service. These establishments span various cuisines and are renowned for their warm hospitality and welcoming ambiance, making them perfect for family gatherings, special occasions, or simply unwinding. Their extensive menus range from appetizers to indulgent desserts and wines and cocktails. This space is extremely fragmented and competition includes everything from publicly-traded companies owning multiple chains to single-location mom-and-pop restaurants.
The 12 sit-down dining stocks we track reported a mixed Q2. As a group, revenues beat analysts’ consensus estimates by 1% while next quarter’s revenue guidance was 5.4% below.
While some sit-down dining stocks have fared somewhat better than others, they have collectively declined. On average, share prices are down 3% since the latest earnings results.
Weakest Q2: Bloomin' Brands (NASDAQ: BLMN)
Owner of the iconic Australian-themed Outback Steakhouse, Bloomin’ Brands (NASDAQ: BLMN) is a leading American restaurant company that owns and operates a portfolio of popular restaurant brands.
Bloomin' Brands reported revenues of $1.00 billion, down 10.4% year on year. This print exceeded analysts’ expectations by 1.4%. Despite the top-line beat, it was still a softer quarter for the company with full-year EPS guidance missing analysts’ expectations significantly.
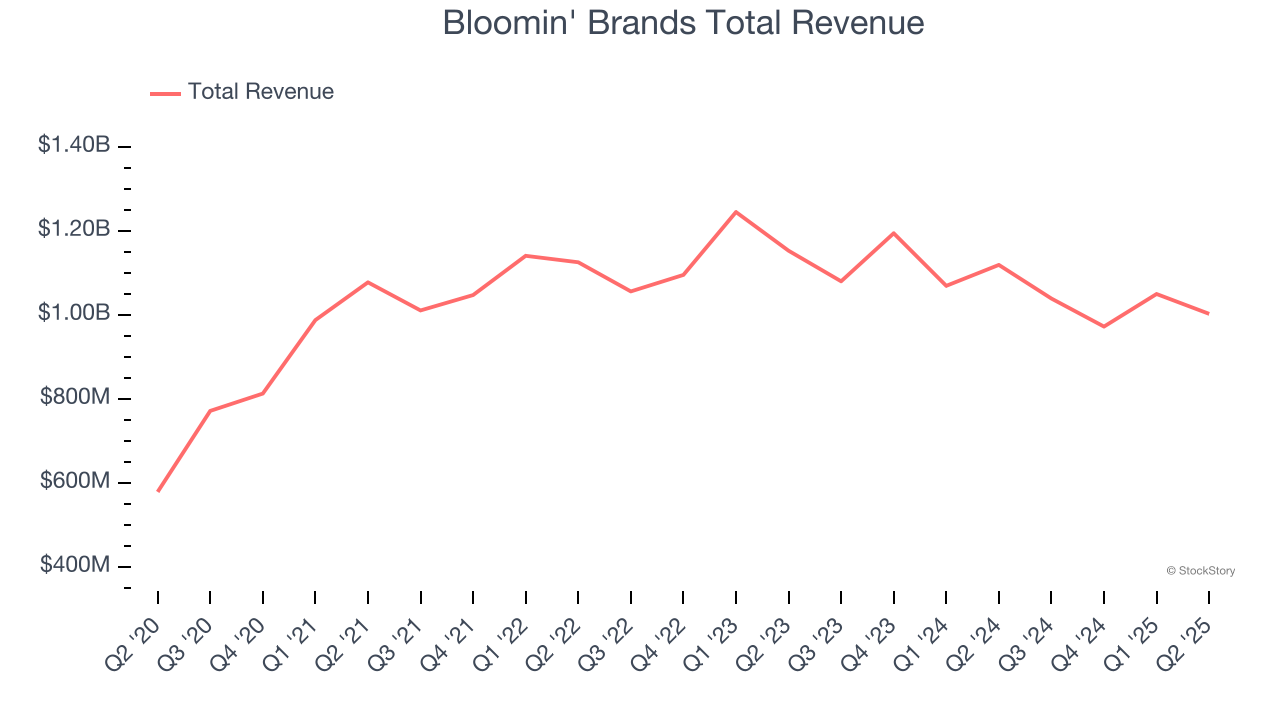
Bloomin' Brands delivered the slowest revenue growth of the whole group. Unsurprisingly, the stock is down 19.8% since reporting and currently trades at $7.20.
Read our full report on Bloomin' Brands here, it’s free.
Best Q2: Kura Sushi (NASDAQ: KRUS)
Known for its conveyor belt that transports dishes to diners, Kura Sushi (NASDAQ: KRUS) is a chain of sushi restaurants serving traditional Japanese fare with a touch of modernity and technology.
Kura Sushi reported revenues of $73.97 million, up 17.3% year on year, outperforming analysts’ expectations by 2.5%. The business had a very strong quarter with a beat of analysts’ EPS estimates and a solid beat of analysts’ EBITDA estimates.
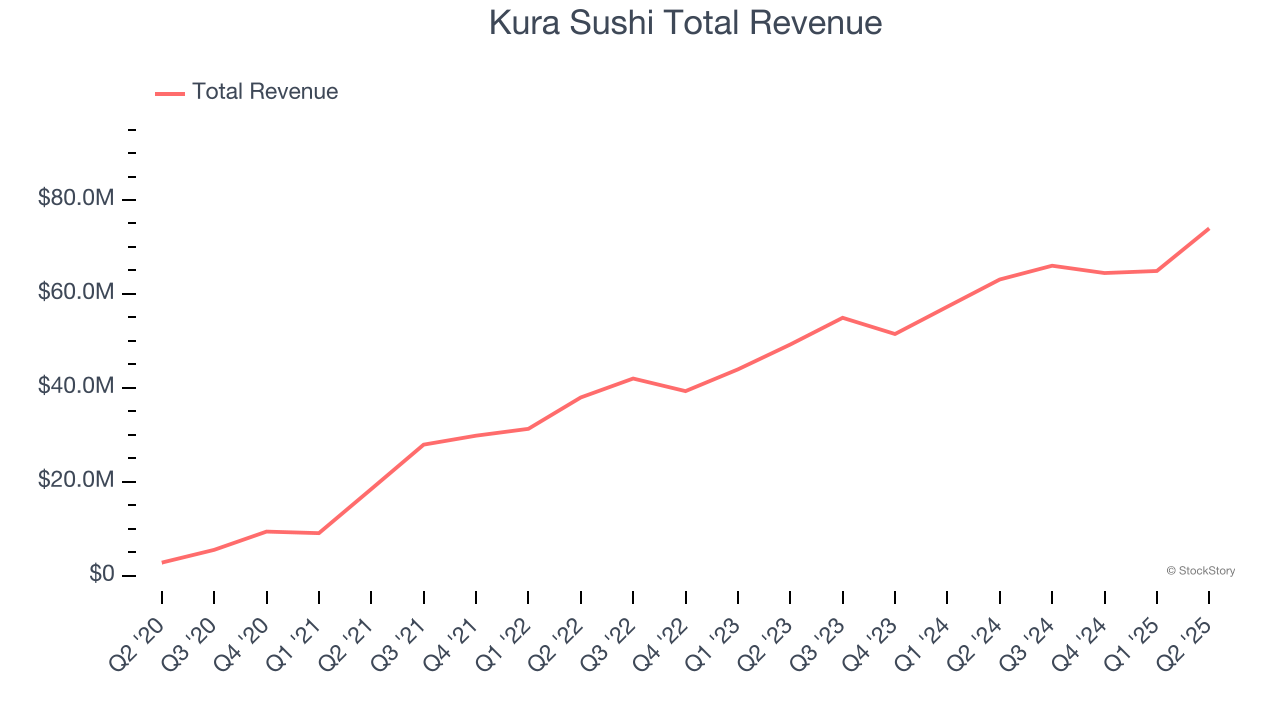
Kura Sushi achieved the highest full-year guidance raise among its peers. Although it had a fine quarter compared its peers, the market seems unhappy with the results as the stock is down 12% since reporting. It currently trades at $76.33.
Is now the time to buy Kura Sushi? Access our full analysis of the earnings results here, it’s free.
Denny's (NASDAQ: DENN)
Open around the clock, Denny’s (NASDAQ: DENN) is a chain of diner restaurants serving breakfast and traditional American fare.
Denny's reported revenues of $117.7 million, up 1.5% year on year, falling short of analysts’ expectations by 0.5%. It was a slower quarter as it posted a significant miss of analysts’ EBITDA estimates and a significant miss of analysts’ EPS estimates.
Interestingly, the stock is up 8.3% since the results and currently trades at $3.96.
Read our full analysis of Denny’s results here.
Darden (NYSE: DRI)
Founded in 1968 as Red Lobster, Darden (NYSE: DRI) is a leading American restaurant company that owns and operates a portfolio of popular restaurant brands.
Darden reported revenues of $3.27 billion, up 10.6% year on year. This number met analysts’ expectations. Taking a step back, it was a mixed quarter as it also recorded an impressive beat of analysts’ same-store sales estimates but a significant miss of analysts’ EPS estimates.
The stock is down 7.8% since reporting and currently trades at $205.41.
Read our full, actionable report on Darden here, it’s free.
Texas Roadhouse (NASDAQ: TXRH)
With locations often featuring Western-inspired decor, Texas Roadhouse (NASDAQ: TXRH) is an American restaurant chain specializing in Southern-style cuisine and steaks.
Texas Roadhouse reported revenues of $1.51 billion, up 12.7% year on year. This result surpassed analysts’ expectations by 0.6%. Aside from that, it was a mixed quarter as it also logged a solid beat of analysts’ same-store sales estimates but a miss of analysts’ EBITDA estimates.
The stock is down 6.2% since reporting and currently trades at $173.64.
Read our full, actionable report on Texas Roadhouse here, it’s free.
Market Update
Thanks to the Fed’s series of rate hikes in 2022 and 2023, inflation has cooled significantly from its post-pandemic highs, drawing closer to the 2% goal. This disinflation has occurred without severely impacting economic growth, suggesting the success of a soft landing. The stock market thrived in 2024, spurred by recent rate cuts (0.5% in September and 0.25% in November), and a notable surge followed Donald Trump’s presidential election win in November, propelling indices to historic highs. Nonetheless, the outlook for 2025 remains clouded by potential trade policy changes and corporate tax discussions, which could impact business confidence and growth. The path forward holds both optimism and caution as new policies take shape.
Want to invest in winners with rock-solid fundamentals? Check out our Top 6 Stocks and add them to your watchlist. These companies are poised for growth regardless of the political or macroeconomic climate.
StockStory is growing and hiring equity analyst and marketing roles. Are you a 0 to 1 builder passionate about the markets and AI? See the open roles here.