
Security and healthcare technology company OSI Systems (NASDAQ: OSIS) announced better-than-expected revenue in Q2 CY2025, with sales up 5% year on year to $505 million. The company’s full-year revenue guidance of $1.83 billion at the midpoint came in 2% above analysts’ estimates. Its non-GAAP profit of $3.24 per share was 1.6% above analysts’ consensus estimates.
Is now the time to buy OSI Systems? Find out by accessing our full research report, it’s free.
OSI Systems (OSIS) Q2 CY2025 Highlights:
- Revenue: $505 million vs analyst estimates of $493.7 million (5% year-on-year growth, 2.3% beat)
- Adjusted EPS: $3.24 vs analyst estimates of $3.19 (1.6% beat)
- Adjusted EPS guidance for the upcoming financial year 2026 is $10.25 at the midpoint, beating analyst estimates by 2.1%
- Operating Margin: 14.5%, up from 13.1% in the same quarter last year
- Backlog: $1.8 billion at quarter end
- Market Capitalization: $3.75 billion
Ajay Mehra, OSI Systems’ President and Chief Executive Officer, stated: “We are pleased to report record-breaking fourth quarter and 2025 fiscal year revenues and non-GAAP earnings per share, led by excellent execution in our Security division. Fourth quarter performance was driven by strong growth in the Security division’s service revenues resulting from an increasing installed base of our products. With robust bookings, solid backlog and high visibility into our opportunity pipeline, we are poised for success in fiscal 2026 and expect to deliver strong cash flow this fiscal year.”
Company Overview
With security scanners deployed at airports and borders worldwide and patient monitors used in hospitals across the globe, OSI Systems (NASDAQ: OSIS) designs and manufactures specialized electronic systems for security screening, patient monitoring, and optoelectronic applications.
Revenue Growth
Examining a company’s long-term performance can provide clues about its quality. Any business can put up a good quarter or two, but many enduring ones grow for years.
With $1.71 billion in revenue over the past 12 months, OSI Systems is a mid-sized business services company, which sometimes brings disadvantages compared to larger competitors benefiting from better economies of scale. On the bright side, it can still flex high growth rates because it’s working from a smaller revenue base.
As you can see below, OSI Systems grew its sales at a solid 8% compounded annual growth rate over the last five years. This is an encouraging starting point for our analysis because it shows OSI Systems’s demand was higher than many business services companies.
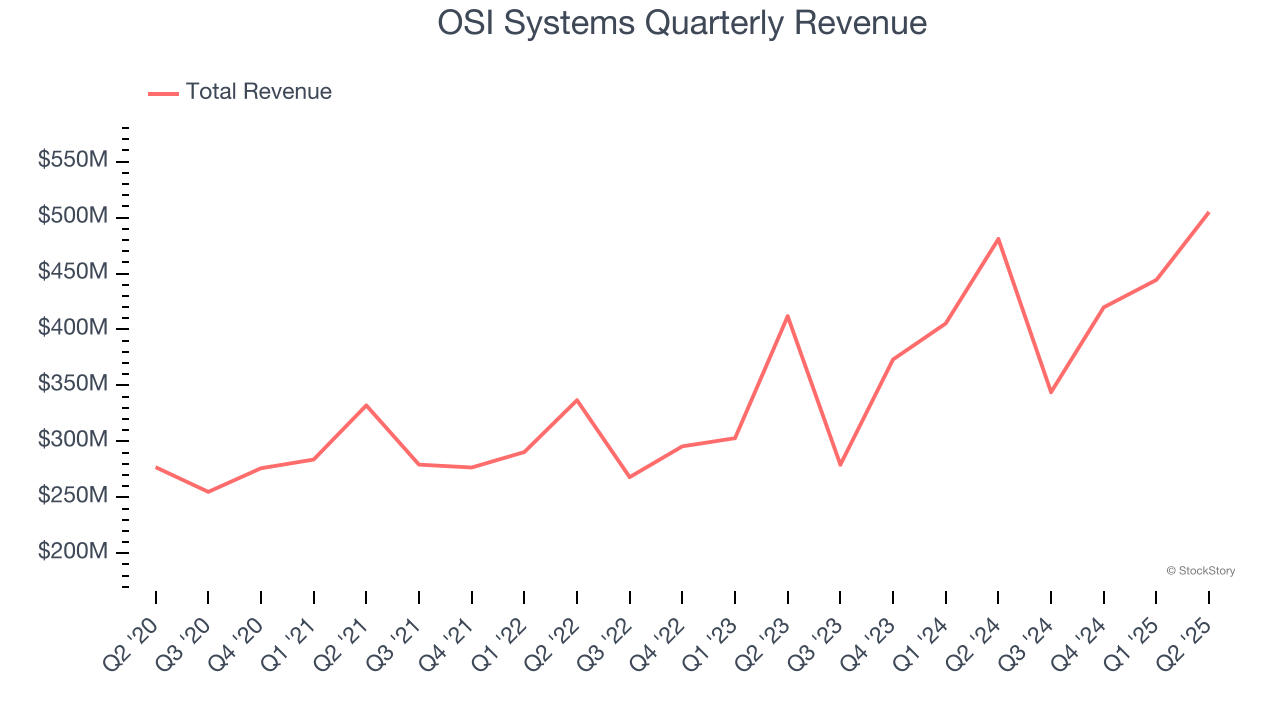
Long-term growth is the most important, but within business services, a half-decade historical view may miss new innovations or demand cycles. OSI Systems’s annualized revenue growth of 15.8% over the last two years is above its five-year trend, suggesting its demand was strong and recently accelerated. 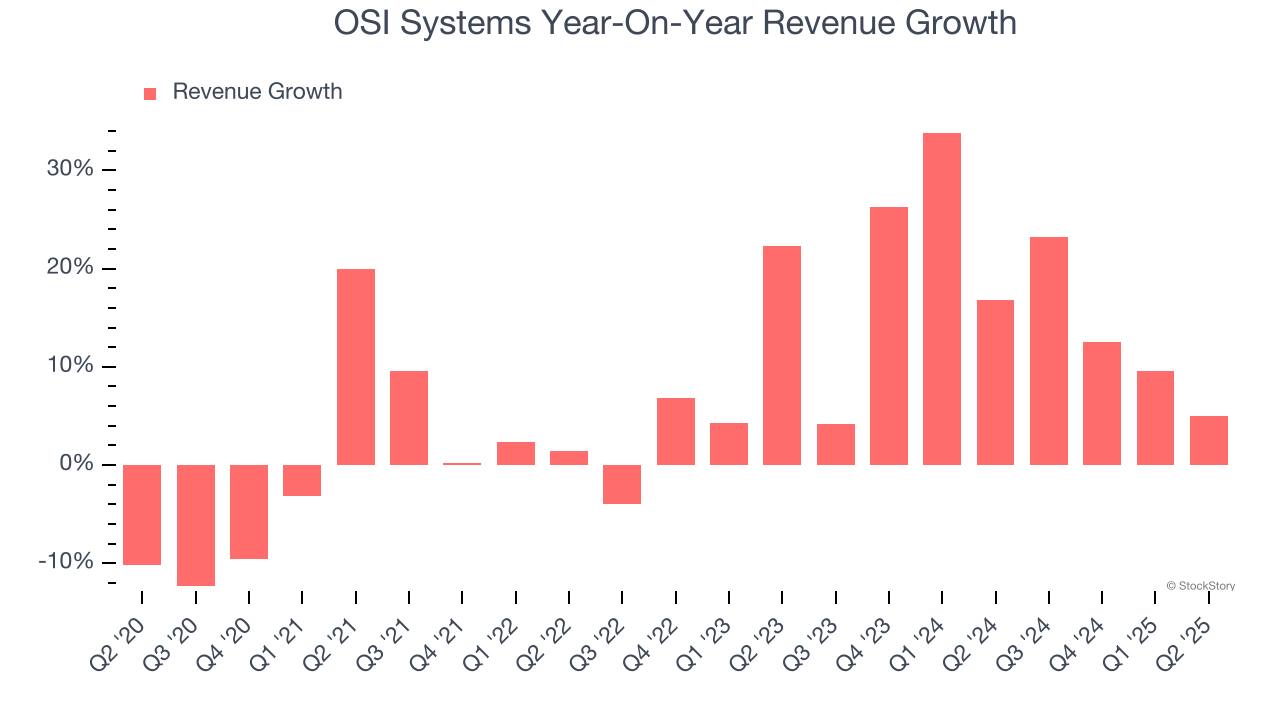
OSI Systems also breaks out the revenue for its most important segment, Security. Over the last two years, OSI Systems’s Security revenue (inspection systems) averaged 26.6% year-on-year growth. This segment has outperformed its total sales during the same period, lifting the company’s performance. 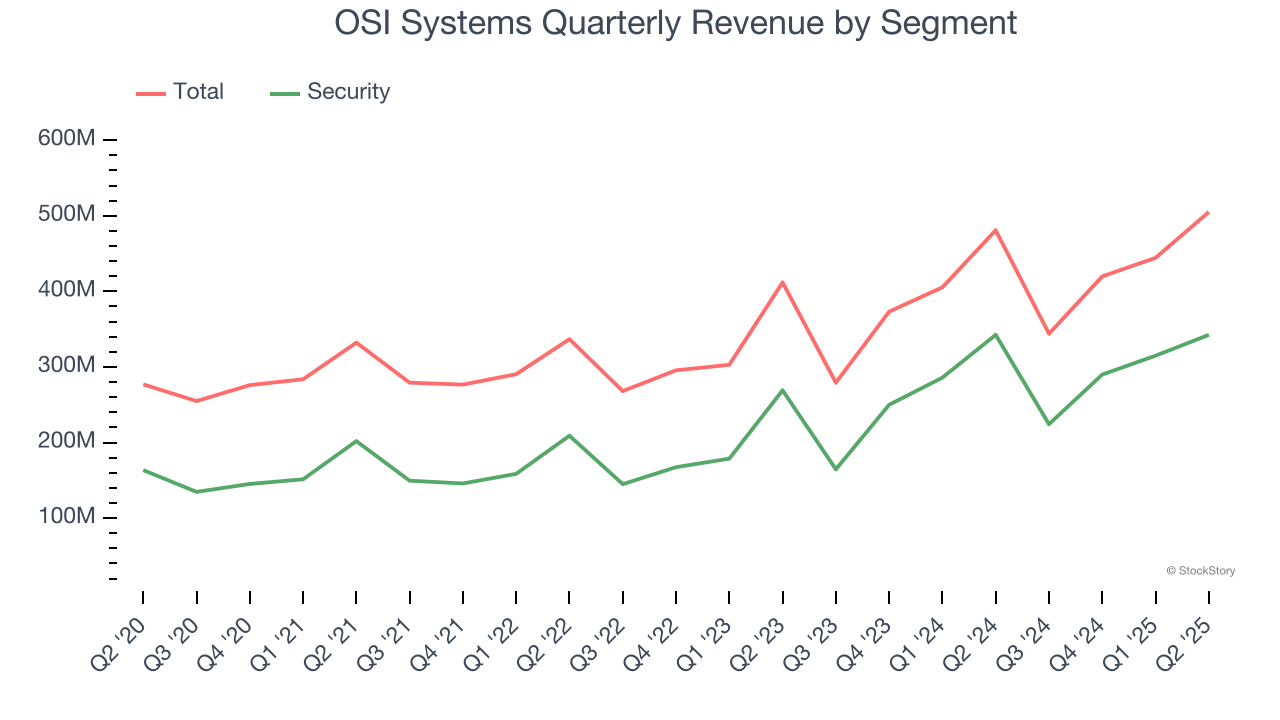
This quarter, OSI Systems reported year-on-year revenue growth of 5%, and its $505 million of revenue exceeded Wall Street’s estimates by 2.3%.
Looking ahead, sell-side analysts expect revenue to grow 4.9% over the next 12 months, a deceleration versus the last two years. This projection is underwhelming and suggests its products and services will see some demand headwinds. At least the company is tracking well in other measures of financial health.
Unless you’ve been living under a rock, it should be obvious by now that generative AI is going to have a huge impact on how large corporations do business. While Nvidia and AMD are trading close to all-time highs, we prefer a lesser-known (but still profitable) stock benefiting from the rise of AI. Click here to access our free report one of our favorites growth stories.
Operating Margin
Operating margin is one of the best measures of profitability because it tells us how much money a company takes home after subtracting all core expenses, like marketing and R&D.
OSI Systems has done a decent job managing its cost base over the last five years. The company has produced an average operating margin of 11.4%, higher than the broader business services sector.
Looking at the trend in its profitability, OSI Systems’s operating margin rose by 2.6 percentage points over the last five years, as its sales growth gave it operating leverage.
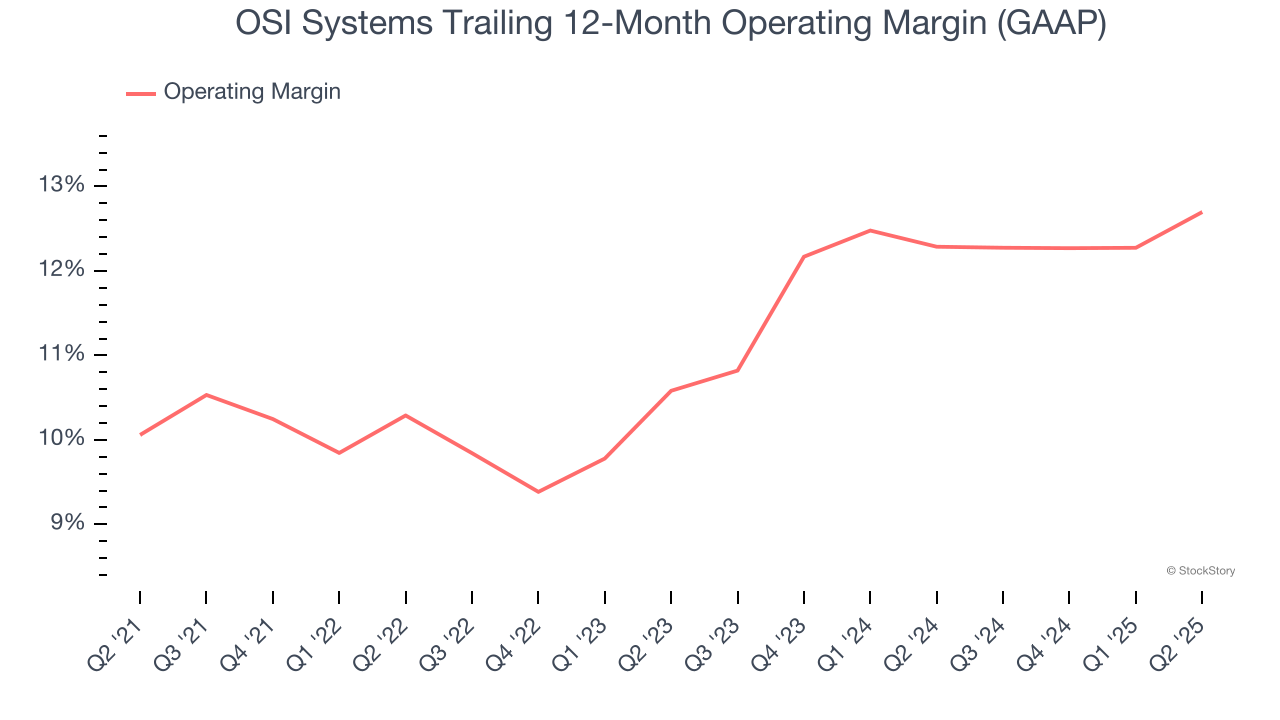
This quarter, OSI Systems generated an operating margin profit margin of 14.5%, up 1.4 percentage points year on year. This increase was a welcome development and shows it was more efficient.
Earnings Per Share
We track the long-term change in earnings per share (EPS) for the same reason as long-term revenue growth. Compared to revenue, however, EPS highlights whether a company’s growth is profitable.
OSI Systems’s EPS grew at an astounding 15.2% compounded annual growth rate over the last five years, higher than its 8% annualized revenue growth. This tells us the company became more profitable on a per-share basis as it expanded.
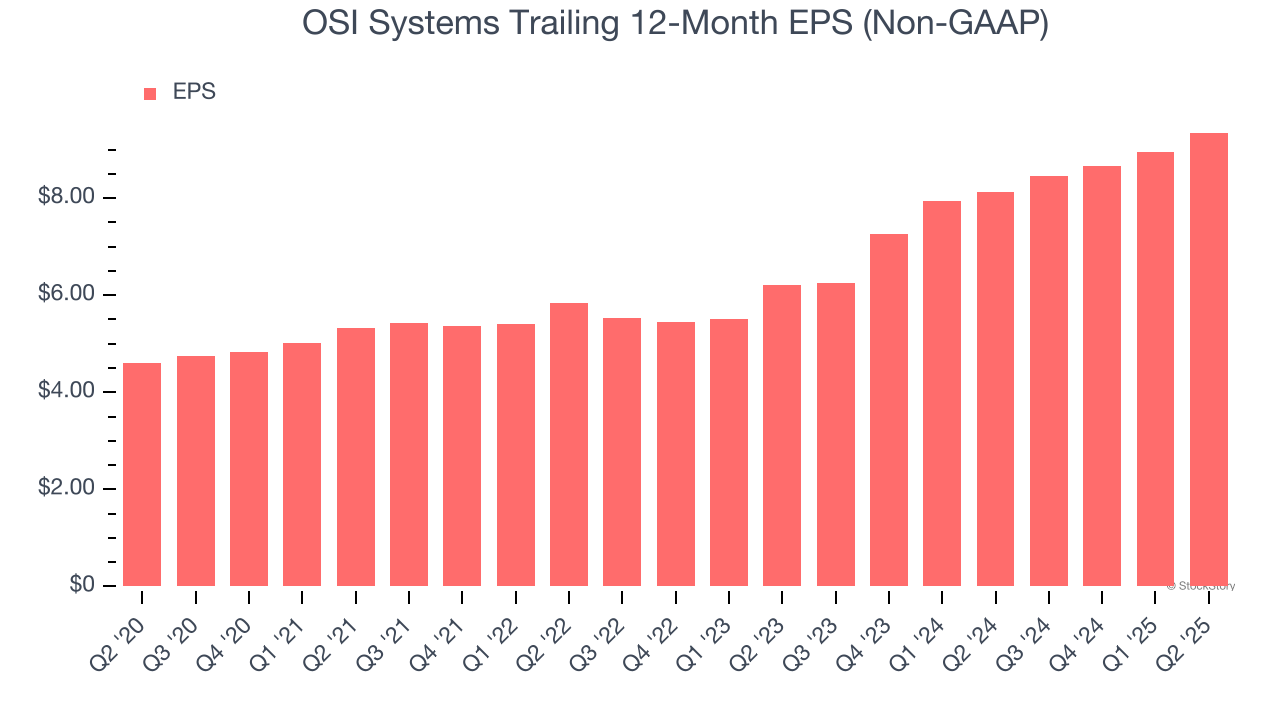
We can take a deeper look into OSI Systems’s earnings to better understand the drivers of its performance. As we mentioned earlier, OSI Systems’s operating margin expanded by 2.6 percentage points over the last five years. On top of that, its share count shrank by 5%. These are positive signs for shareholders because improving profitability and share buybacks turbocharge EPS growth relative to revenue growth. 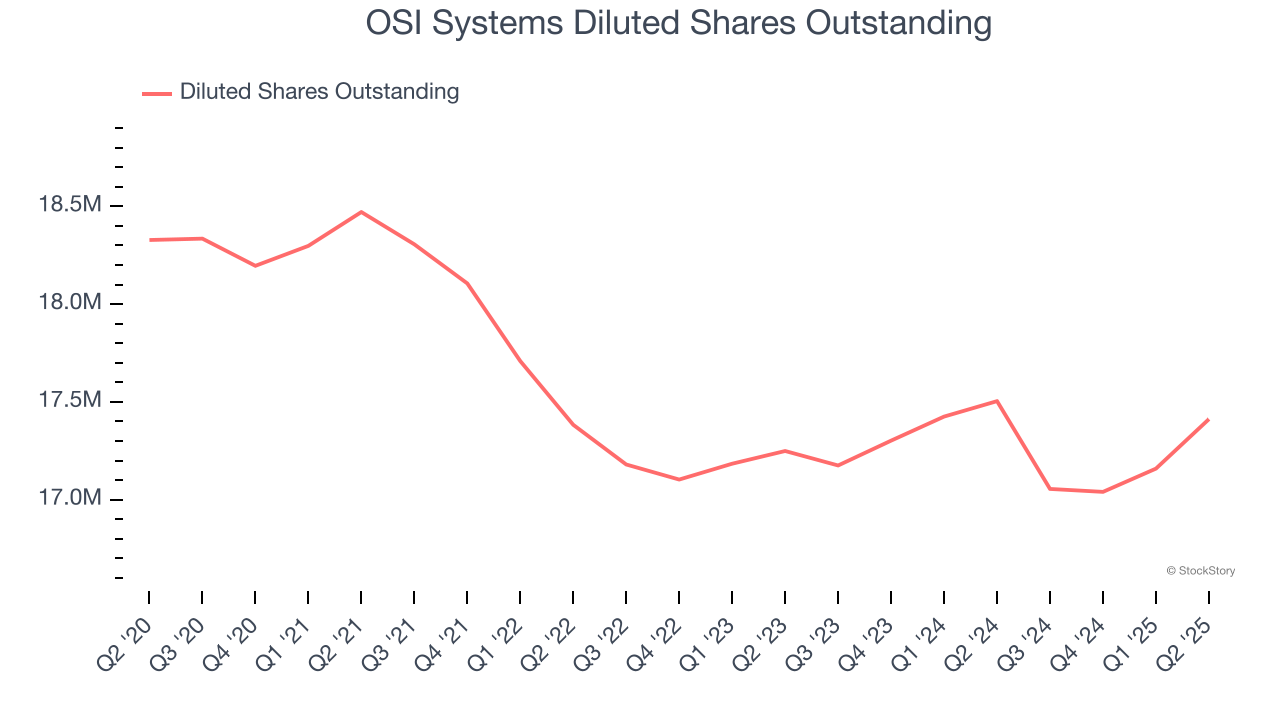
Like with revenue, we analyze EPS over a more recent period because it can provide insight into an emerging theme or development for the business.
For OSI Systems, its two-year annual EPS growth of 22.7% was higher than its five-year trend. We love it when earnings growth accelerates, especially when it accelerates off an already high base.
In Q2, OSI Systems reported adjusted EPS of $3.24, up from $2.84 in the same quarter last year. This print beat analysts’ estimates by 1.6%. Over the next 12 months, Wall Street expects OSI Systems’s full-year EPS of $9.35 to grow 8.3%.
Key Takeaways from OSI Systems’s Q2 Results
It was encouraging to see OSI Systems beat analysts’ revenue expectations this quarter. We were also happy its full-year EPS guidance outperformed Wall Street’s estimates. Overall, we think this was a decent quarter with some key metrics above expectations. The stock traded up 2.1% to $228 immediately after reporting.
OSI Systems may have had a good quarter, but does that mean you should invest right now? When making that decision, it’s important to consider its valuation, business qualities, as well as what has happened in the latest quarter. We cover that in our actionable full research report which you can read here, it’s free.