
Snow and ice equipment company Douglas Dynamics (NYSE: PLOW) reported Q2 CY2025 results topping the market’s revenue expectations, but sales fell by 2.8% year on year to $194.3 million. The company’s full-year revenue guidance of $645 million at the midpoint came in 2.8% above analysts’ estimates. Its non-GAAP profit of $1.14 per share was 29.5% above analysts’ consensus estimates.
Is now the time to buy Douglas Dynamics? Find out by accessing our full research report, it’s free.
Douglas Dynamics (PLOW) Q2 CY2025 Highlights:
- Revenue: $194.3 million vs analyst estimates of $182.8 million (2.8% year-on-year decline, 6.3% beat)
- Adjusted EPS: $1.14 vs analyst estimates of $0.88 (29.5% beat)
- Adjusted EBITDA: $42.6 million vs analyst estimates of $33.65 million (21.9% margin, 26.6% beat)
- Adjusted EPS guidance for the full year is $1.90 at the midpoint, missing analyst estimates by 2.9%
- EBITDA guidance for the full year is $89.5 million at the midpoint, below analyst estimates of $90.55 million
- Operating Margin: 19%, in line with the same quarter last year
- Free Cash Flow was -$14.35 million, down from $1.08 million in the same quarter last year
- Market Capitalization: $647.8 million
“We take great pride in the fact that strong execution, unwavering dedication, and market leading innovation remain defining hallmarks of our company,” commented Mark Van Genderen, President and CEO.
Company Overview
Once manufacturing snowplows designed for the iconic jeep vehicle precursor, Douglas Dynamics (NYSE: PLOW) offers snow and ice equipment for the roads and sidewalks.
Revenue Growth
Examining a company’s long-term performance can provide clues about its quality. Any business can experience short-term success, but top-performing ones enjoy sustained growth for years. Regrettably, Douglas Dynamics’s sales grew at a sluggish 3.5% compounded annual growth rate over the last five years. This fell short of our benchmark for the industrials sector and is a poor baseline for our analysis.
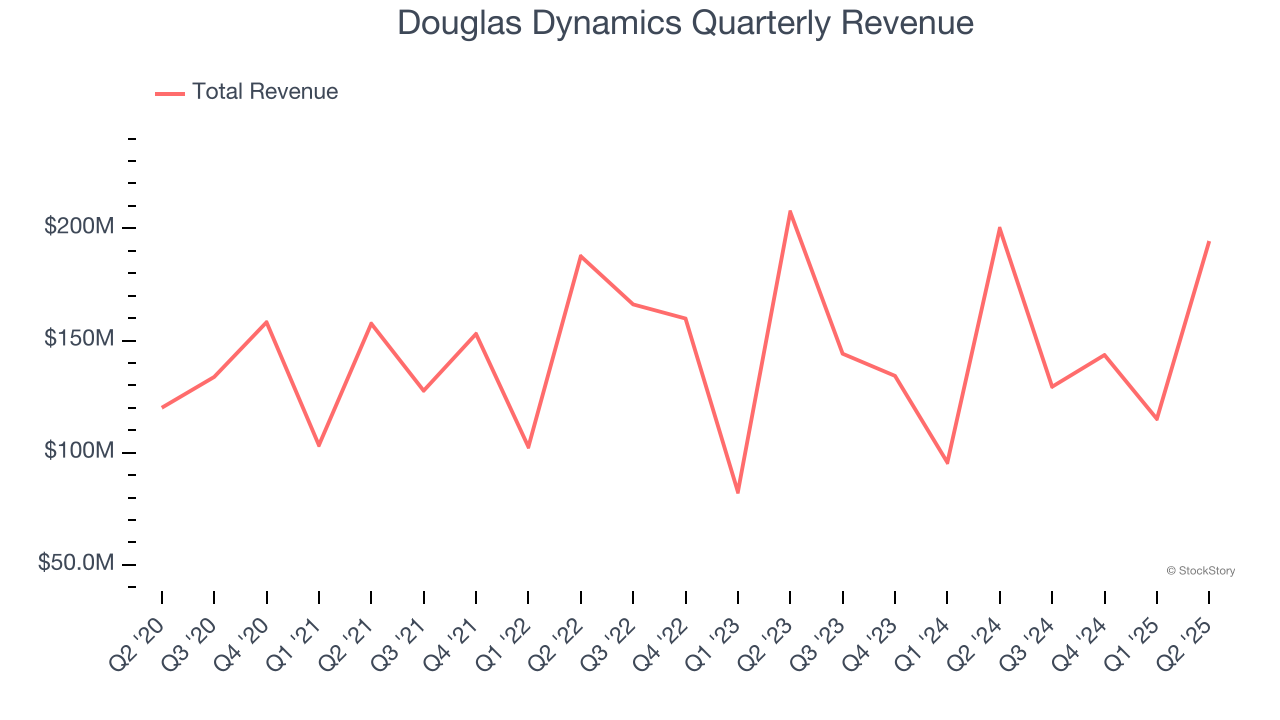
We at StockStory place the most emphasis on long-term growth, but within industrials, a half-decade historical view may miss cycles, industry trends, or a company capitalizing on catalysts such as a new contract win or a successful product line. Douglas Dynamics’s performance shows it grew in the past but relinquished its gains over the last two years, as its revenue fell by 2.7% annually. Douglas Dynamics isn’t alone in its struggles as the Heavy Transportation Equipment industry experienced a cyclical downturn, with many similar businesses observing lower sales at this time. 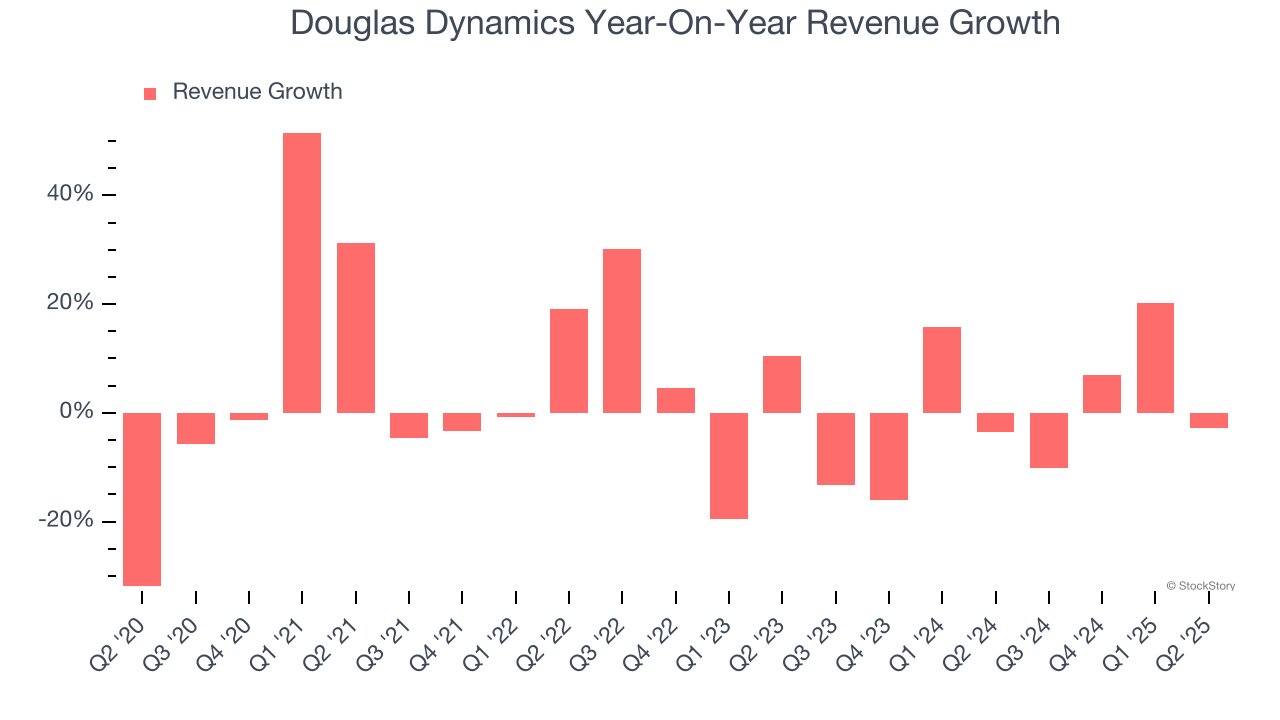
This quarter, Douglas Dynamics’s revenue fell by 2.8% year on year to $194.3 million but beat Wall Street’s estimates by 6.3%.
Looking ahead, sell-side analysts expect revenue to grow 11.9% over the next 12 months, an improvement versus the last two years. This projection is healthy and suggests its newer products and services will fuel better top-line performance.
Unless you’ve been living under a rock, it should be obvious by now that generative AI is going to have a huge impact on how large corporations do business. While Nvidia and AMD are trading close to all-time highs, we prefer a lesser-known (but still profitable) stock benefiting from the rise of AI. Click here to access our free report one of our favorites growth stories.
Operating Margin
Douglas Dynamics has managed its cost base well over the last five years. It demonstrated solid profitability for an industrials business, producing an average operating margin of 10%. This result was particularly impressive because of its low gross margin, which is mostly a factor of what it sells and takes huge shifts to move meaningfully. Companies have more control over their operating margins, and it’s a show of well-managed operations if they’re high when gross margins are low.
Analyzing the trend in its profitability, Douglas Dynamics’s operating margin decreased by 3.8 percentage points over the last five years. This raises questions about the company’s expense base because its revenue growth should have given it leverage on its fixed costs, resulting in better economies of scale and profitability.
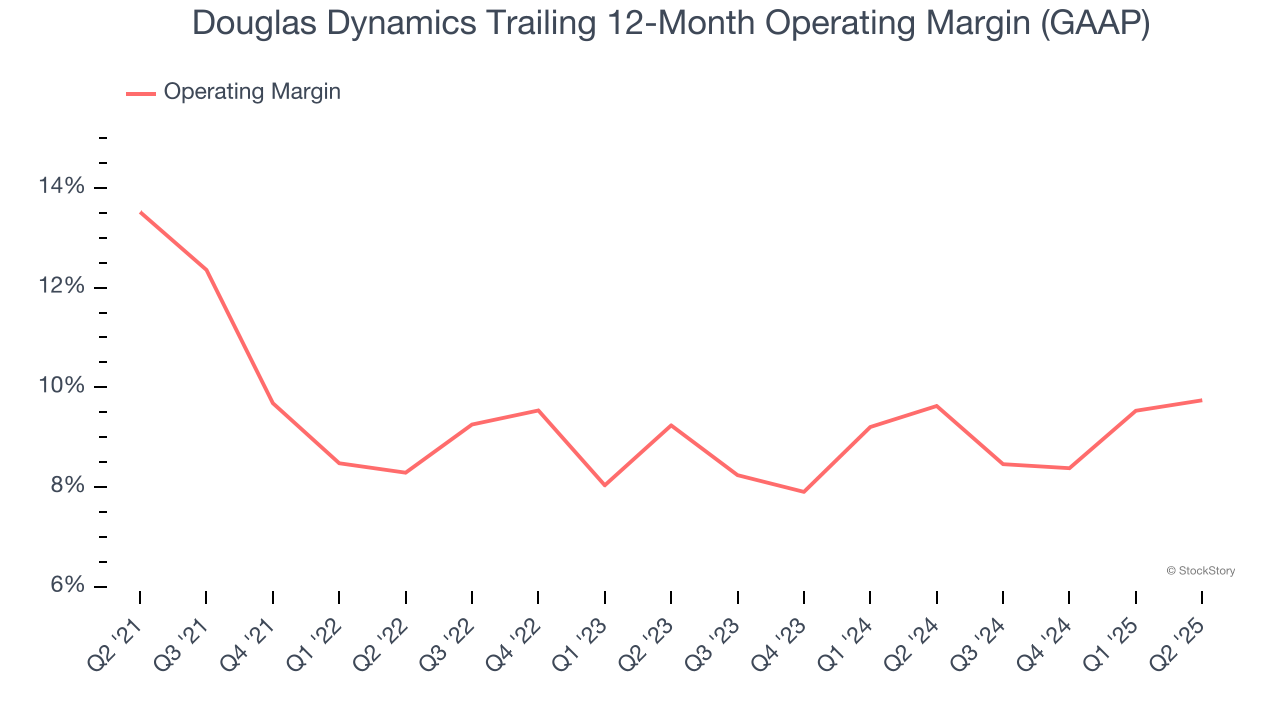
In Q2, Douglas Dynamics generated an operating margin profit margin of 19%, in line with the same quarter last year. This indicates the company’s cost structure has recently been stable.
Earnings Per Share
Revenue trends explain a company’s historical growth, but the long-term change in earnings per share (EPS) points to the profitability of that growth – for example, a company could inflate its sales through excessive spending on advertising and promotions.
Douglas Dynamics’s EPS grew at a decent 8.1% compounded annual growth rate over the last five years, higher than its 3.5% annualized revenue growth. This tells us the company became more profitable on a per-share basis as it expanded.
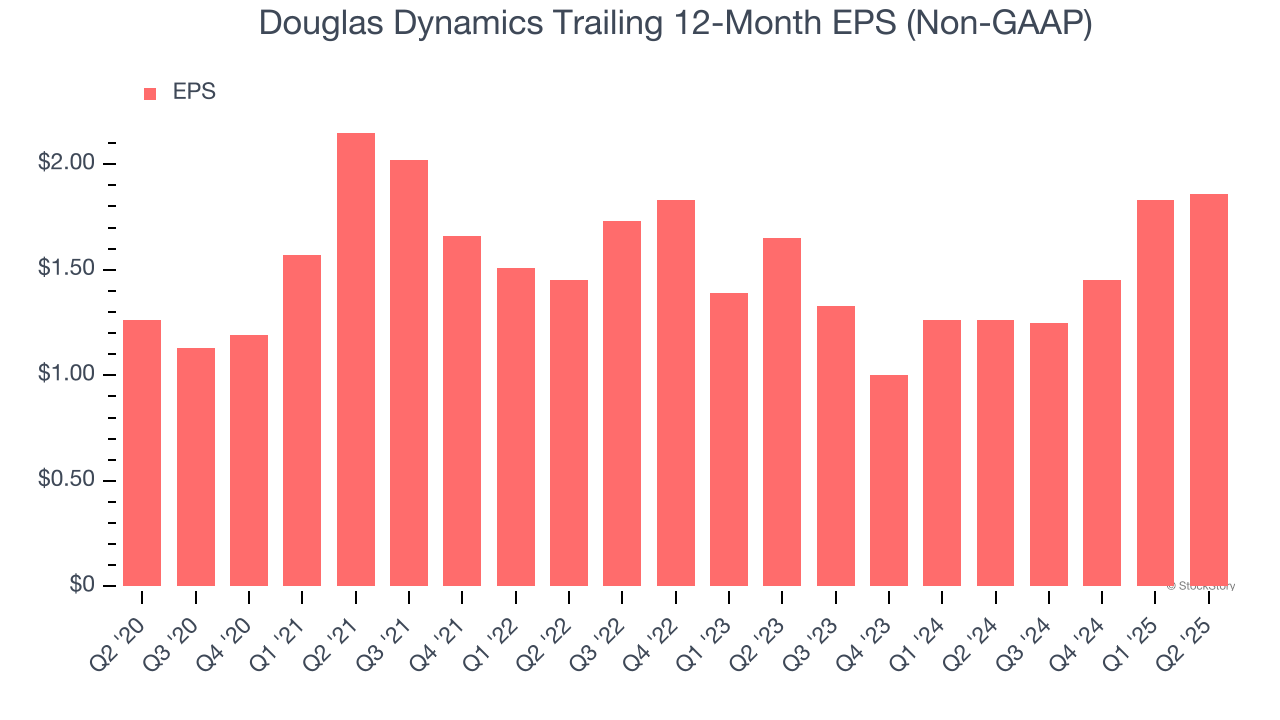
Like with revenue, we analyze EPS over a shorter period to see if we are missing a change in the business.
For Douglas Dynamics, its two-year annual EPS growth of 6.2% was lower than its five-year trend. We hope its growth can accelerate in the future.
In Q2, Douglas Dynamics reported adjusted EPS at $1.14, up from $1.11 in the same quarter last year. This print easily cleared analysts’ estimates, and shareholders should be content with the results. Over the next 12 months, Wall Street expects Douglas Dynamics’s full-year EPS of $1.86 to grow 17%.
Key Takeaways from Douglas Dynamics’s Q2 Results
While revenue and EBITDA in the quarter beat, full-year EBITDA guidance slightly missed. Zooming out, we think this was a mixed print. The stock remained flat at $28.32 immediately following the results.
Douglas Dynamics may have had a good quarter, but does that mean you should invest right now? When making that decision, it’s important to consider its valuation, business qualities, as well as what has happened in the latest quarter. We cover that in our actionable full research report which you can read here, it’s free.


