
Multi-industry consumer and professional products manufacturer Griffon Corporation (NYSE: GFF) fell short of the market’s revenue expectations in Q2 CY2025, with sales falling 5.3% year on year to $613.6 million. The company’s full-year revenue guidance of $2.5 billion at the midpoint came in 2.3% below analysts’ estimates. Its non-GAAP profit of $1.50 per share was in line with analysts’ consensus estimates.
Is now the time to buy Griffon? Find out by accessing our full research report, it’s free.
Griffon (GFF) Q2 CY2025 Highlights:
- Revenue: $613.6 million vs analyst estimates of $650 million (5.3% year-on-year decline, 5.6% miss)
- Adjusted EPS: $1.50 vs analyst estimates of $1.50 (in line)
- Adjusted EBITDA: $134.7 million vs analyst estimates of $137.6 million (22% margin, 2.1% miss)
- EBITDA guidance for the full year is $587.5 million at the midpoint, above analyst estimates of $532 million
- Operating Margin: -20.5%, down from 16.7% in the same quarter last year
- Free Cash Flow Margin: 18.6%, up from 16.5% in the same quarter last year
- Market Capitalization: $3.87 billion
Company Overview
Initially in the defense industry, Griffon (NYSE: GFF) is a now diversified company specializing in home improvement, professional equipment, and building products.
Revenue Growth
Examining a company’s long-term performance can provide clues about its quality. Any business can have short-term success, but a top-tier one grows for years. Over the last five years, Griffon grew its sales at a sluggish 1.6% compounded annual growth rate. This wasn’t a great result, but there are still things to like about Griffon.
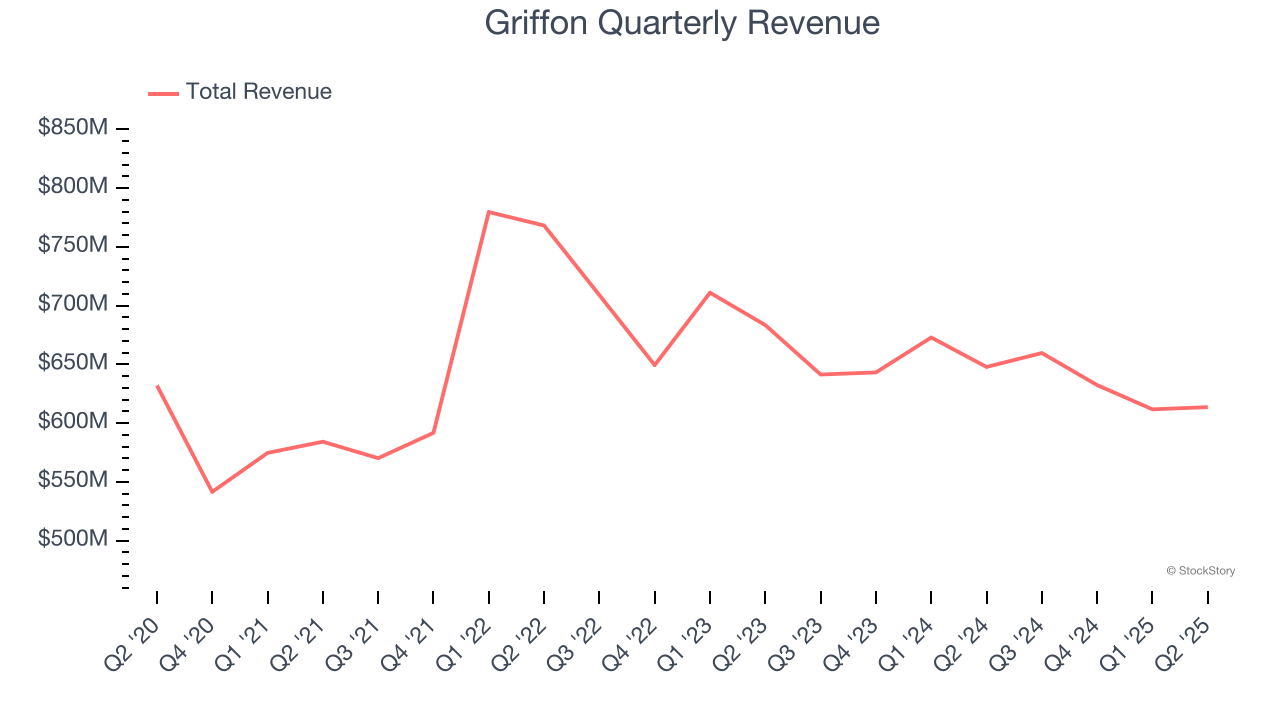
Long-term growth is the most important, but within industrials, a half-decade historical view may miss new industry trends or demand cycles. Griffon’s performance shows it grew in the past but relinquished its gains over the last two years, as its revenue fell by 4.4% annually. 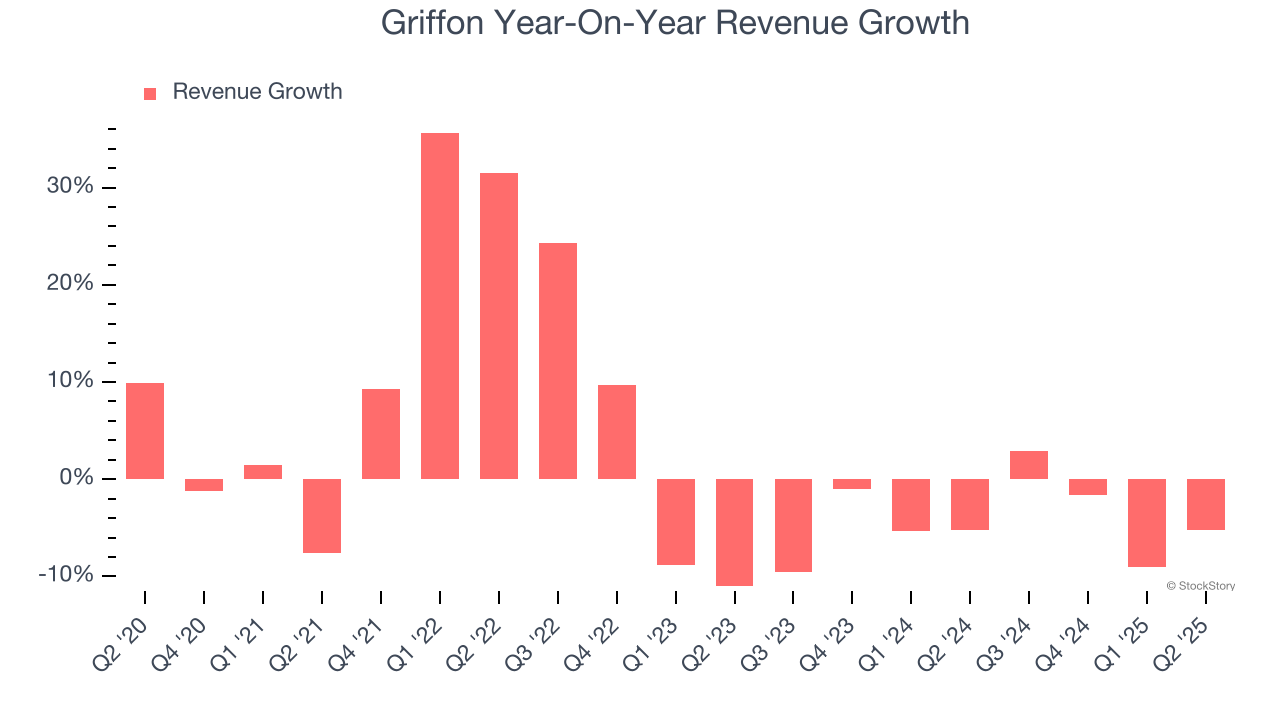
This quarter, Griffon missed Wall Street’s estimates and reported a rather uninspiring 5.3% year-on-year revenue decline, generating $613.6 million of revenue.
Looking ahead, sell-side analysts expect revenue to grow 3.9% over the next 12 months. While this projection suggests its newer products and services will spur better top-line performance, it is still below the sector average. At least the company is tracking well in other measures of financial health.
Here at StockStory, we certainly understand the potential of thematic investing. Diverse winners from Microsoft (MSFT) to Alphabet (GOOG), Coca-Cola (KO) to Monster Beverage (MNST) could all have been identified as promising growth stories with a megatrend driving the growth. So, in that spirit, we’ve identified a relatively under-the-radar profitable growth stock benefiting from the rise of AI, available to you FREE via this link.
Operating Margin
Operating margin is a key measure of profitability. Think of it as net income - the bottom line - excluding the impact of taxes and interest on debt, which are less connected to business fundamentals.
Griffon has been an efficient company over the last five years. It was one of the more profitable businesses in the industrials sector, boasting an average operating margin of 12.1%. This result isn’t surprising as its high gross margin gives it a favorable starting point.
Analyzing the trend in its profitability, Griffon’s operating margin decreased by 4.3 percentage points over the last five years. This raises questions about the company’s expense base because its revenue growth should have given it leverage on its fixed costs, resulting in better economies of scale and profitability.
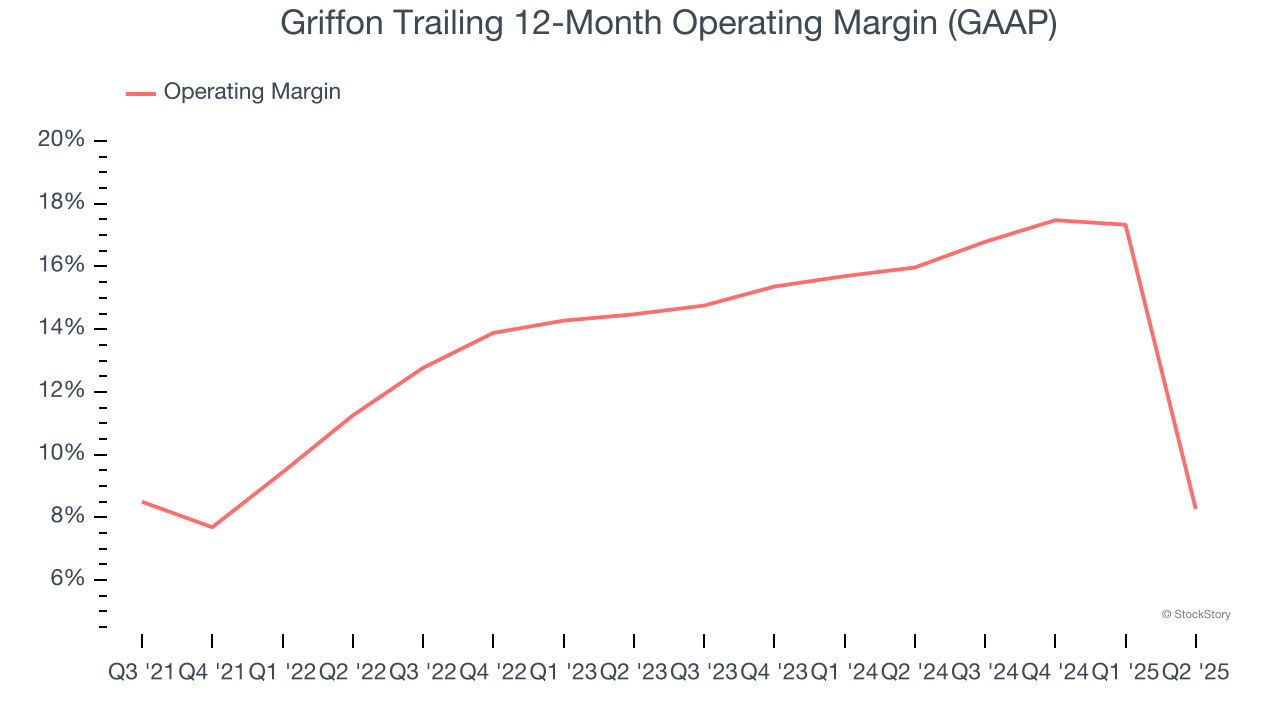
This quarter, Griffon generated an operating margin profit margin of negative 20.5%, down 37.2 percentage points year on year. Conversely, its gross margin actually rose, so we can assume its recent inefficiencies were driven by increased operating expenses like marketing, R&D, and administrative overhead.
Earnings Per Share
Revenue trends explain a company’s historical growth, but the long-term change in earnings per share (EPS) points to the profitability of that growth – for example, a company could inflate its sales through excessive spending on advertising and promotions.
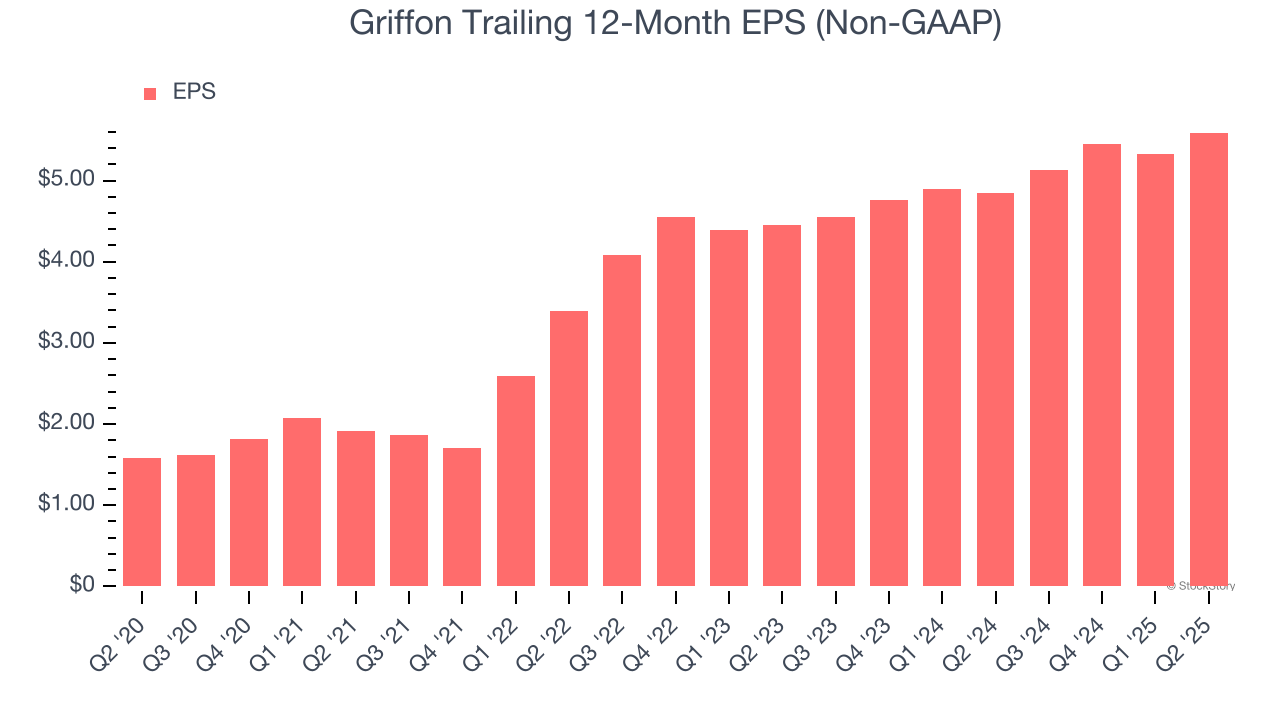
Griffon’s EPS grew at an astounding 28.8% compounded annual growth rate over the last five years, higher than its 1.6% annualized revenue growth. However, we take this with a grain of salt because its operating margin didn’t improve and it didn’t repurchase its shares, meaning the delta came from reduced interest expenses or taxes.
Like with revenue, we analyze EPS over a more recent period because it can provide insight into an emerging theme or development for the business.
Griffon’s two-year annual EPS growth of 12.1% was great and topped its two-year revenue performance.
Diving into the nuances of Griffon’s earnings can give us a better understanding of its performance. A two-year view shows that Griffon has repurchased its stock, shrinking its share count by 17%. This tells us its EPS outperformed its revenue not because of increased operational efficiency but financial engineering, as buybacks boost per share earnings. 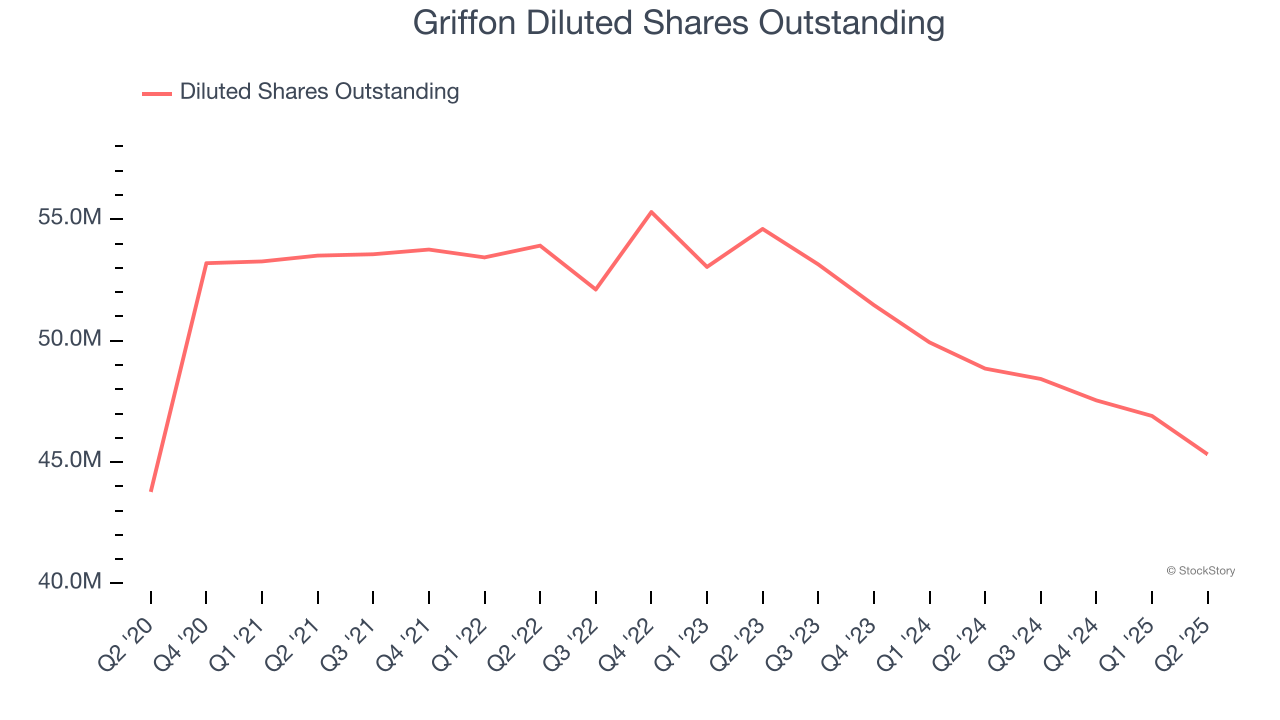
In Q2, Griffon reported adjusted EPS at $1.50, up from $1.24 in the same quarter last year. This print was close to analysts’ estimates. Over the next 12 months, Wall Street expects Griffon’s full-year EPS of $5.59 to grow 9.7%.
Key Takeaways from Griffon’s Q2 Results
We were impressed by Griffon’s optimistic full-year EBITDA guidance, which blew past analysts’ expectations. On the other hand, its revenue missed and its full-year revenue guidance fell short of Wall Street’s estimates. Overall, this was a weaker quarter. The stock traded down 8.4% to $75.49 immediately following the results.
Griffon’s latest earnings report disappointed. One quarter doesn’t define a company’s quality, so let’s explore whether the stock is a buy at the current price. The latest quarter does matter, but not nearly as much as longer-term fundamentals and valuation, when deciding if the stock is a buy. We cover that in our actionable full research report which you can read here, it’s free.


