
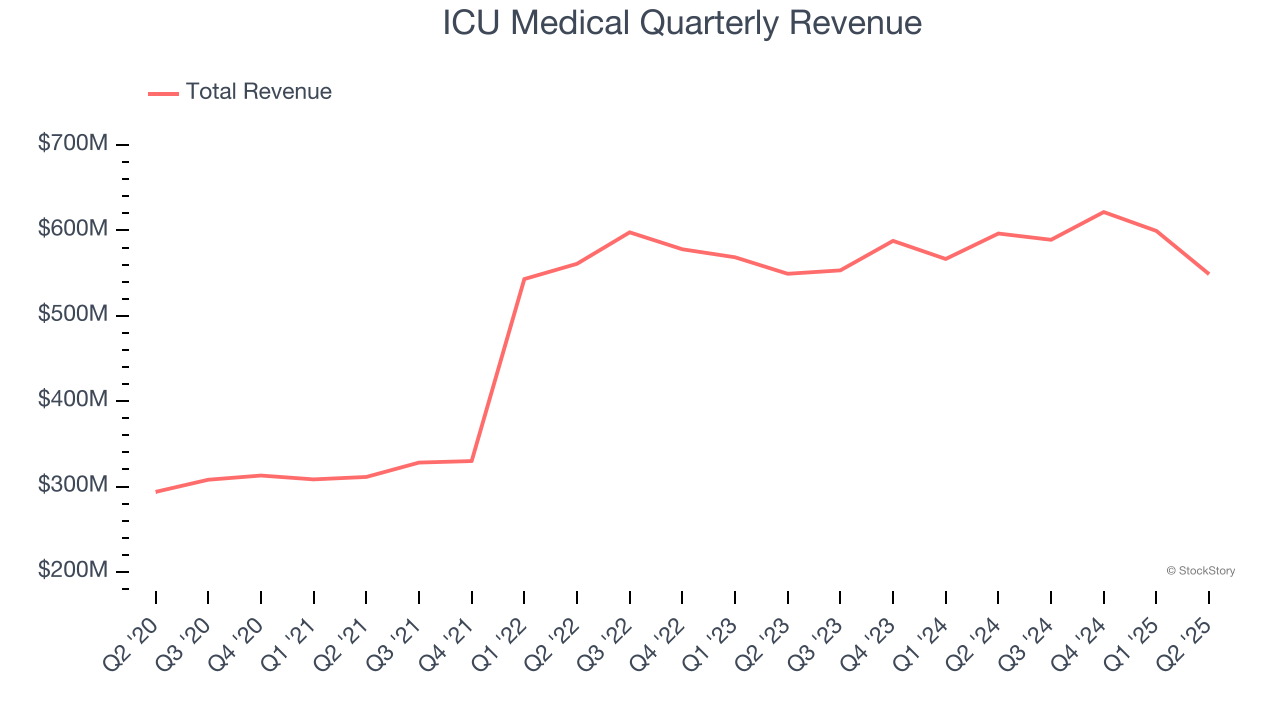
Medical device company ICU Medical (NASDAQ: ICUI) reported Q2 CY2025 results exceeding the market’s revenue expectations, but sales fell by 8% year on year to $548.9 million. Its GAAP profit of $1.43 per share was significantly above analysts’ consensus estimates.
Is now the time to buy ICU Medical? Find out by accessing our full research report, it’s free.
ICU Medical (ICUI) Q2 CY2025 Highlights:
- Revenue: $548.9 million vs analyst estimates of $539.7 million (8% year-on-year decline, 1.7% beat)
- EPS (GAAP): $1.43 vs analyst estimates of -$0.47 (significant beat)
- Adjusted EBITDA: $100.3 million vs analyst estimates of $90.8 million (18.3% margin, 10.5% beat)
- EPS (GAAP) guidance for the full year is $7 at the midpoint, beating analyst estimates by 443%
- EBITDA guidance for the full year is $392.5 million at the midpoint, above analyst estimates of $387.5 million
- Operating Margin: 1.9%, down from 4.1% in the same quarter last year
- Free Cash Flow was -$8.49 million, down from $62.67 million in the same quarter last year
- Market Capitalization: $3.2 billion
Vivek Jain, ICU Medical’s Chief Executive Officer, said, “Second quarter results were generally in line with our expectations."
Company Overview
Founded in 1984 and named for its initial focus on intensive care units, ICU Medical (NASDAQ: ICUI) develops and manufactures medical products for infusion therapy, vascular access, and vital care applications used in hospitals and other healthcare settings.
Revenue Growth
A company’s long-term performance is an indicator of its overall quality. Any business can put up a good quarter or two, but the best consistently grow over the long haul. Thankfully, ICU Medical’s 14.2% annualized revenue growth over the last five years was solid. Its growth beat the average healthcare company and shows its offerings resonate with customers.
We at StockStory place the most emphasis on long-term growth, but within healthcare, a half-decade historical view may miss recent innovations or disruptive industry trends. ICU Medical’s recent performance shows its demand has slowed as its annualized revenue growth of 1.4% over the last two years was below its five-year trend. 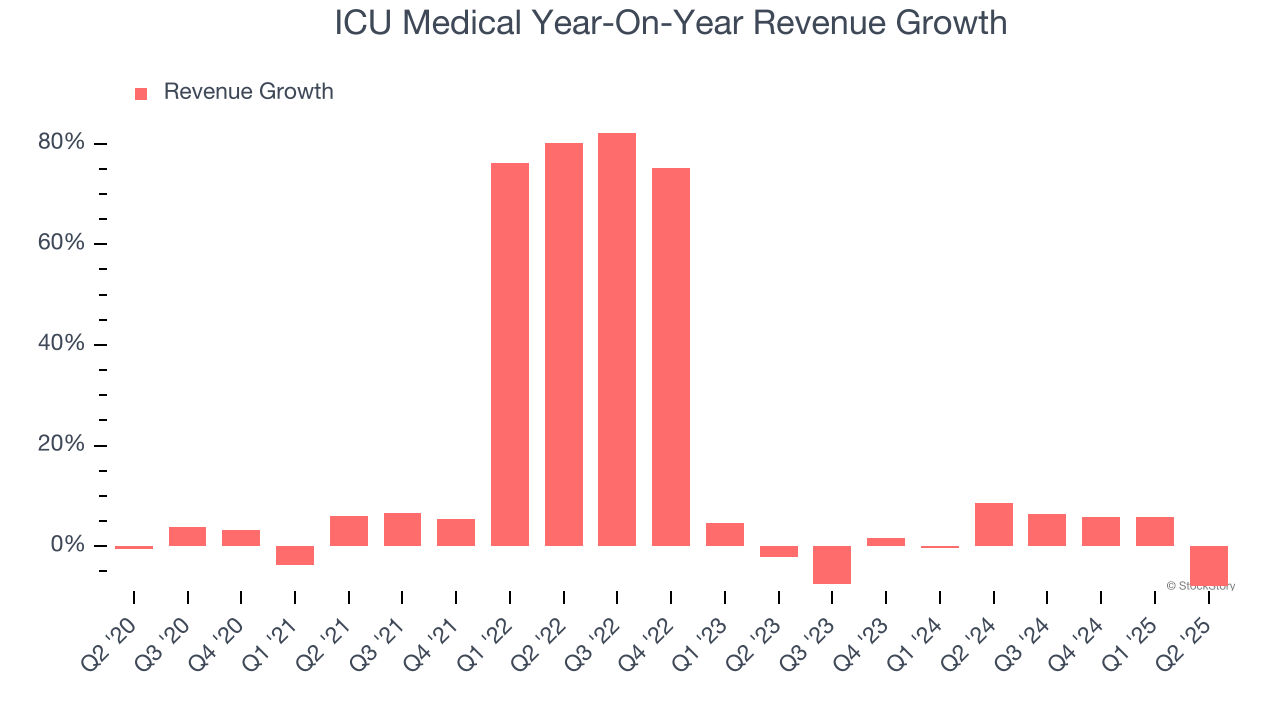
This quarter, ICU Medical’s revenue fell by 8% year on year to $548.9 million but beat Wall Street’s estimates by 1.7%.
Looking ahead, sell-side analysts expect revenue to decline by 10.4% over the next 12 months, a deceleration versus the last two years. This projection is underwhelming and indicates its products and services will face some demand challenges.
Unless you’ve been living under a rock, it should be obvious by now that generative AI is going to have a huge impact on how large corporations do business. While Nvidia and AMD are trading close to all-time highs, we prefer a lesser-known (but still profitable) stock benefiting from the rise of AI. Click here to access our free report one of our favorites growth stories.
Operating Margin
Operating margin is an important measure of profitability as it shows the portion of revenue left after accounting for all core expenses – everything from the cost of goods sold to advertising and wages. It’s also useful for comparing profitability across companies with different levels of debt and tax rates because it excludes interest and taxes.
ICU Medical was profitable over the last five years but held back by its large cost base. Its average operating margin of 3% was weak for a healthcare business.
Analyzing the trend in its profitability, ICU Medical’s operating margin decreased by 4.6 percentage points over the last five years, but it rose by 4.1 percentage points on a two-year basis. Still, shareholders will want to see ICU Medical become more profitable in the future.
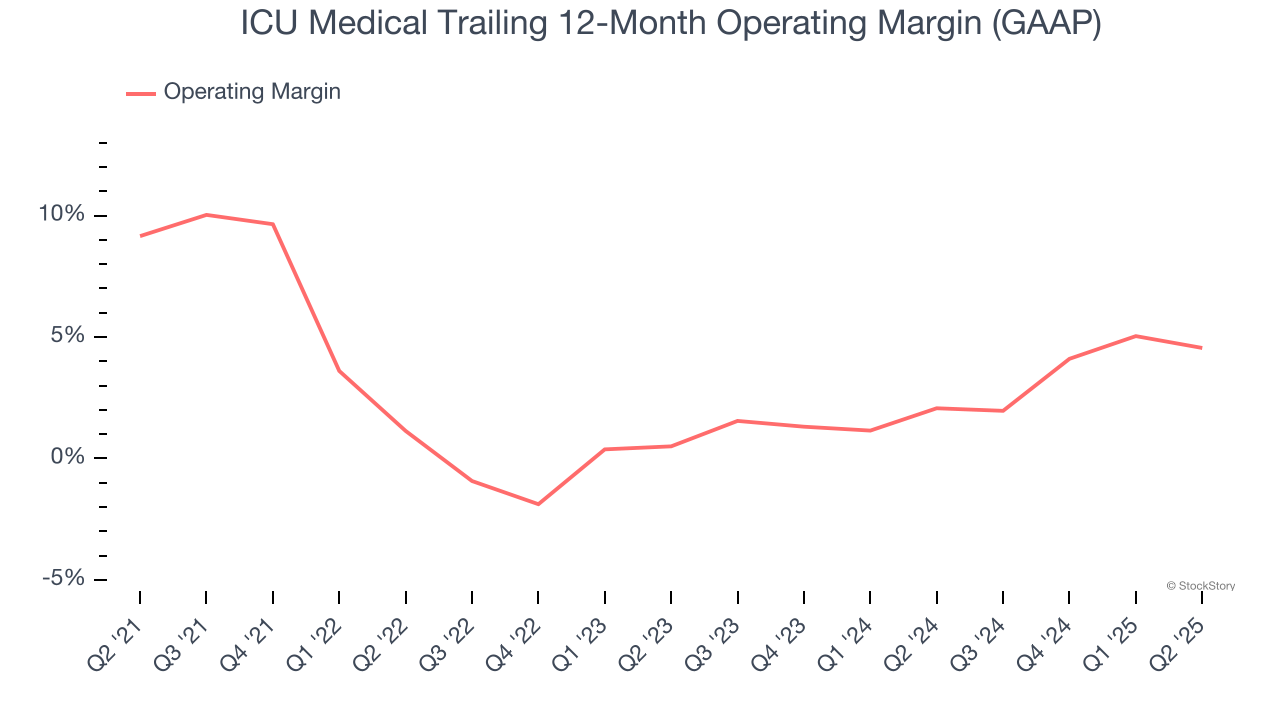
In Q2, ICU Medical generated an operating margin profit margin of 1.9%, down 2.2 percentage points year on year. This contraction shows it was less efficient because its expenses increased relative to its revenue.
Earnings Per Share
Revenue trends explain a company’s historical growth, but the long-term change in earnings per share (EPS) points to the profitability of that growth – for example, a company could inflate its sales through excessive spending on advertising and promotions.
Sadly for ICU Medical, its EPS declined by 19.1% annually over the last five years while its revenue grew by 14.2%. This tells us the company became less profitable on a per-share basis as it expanded.
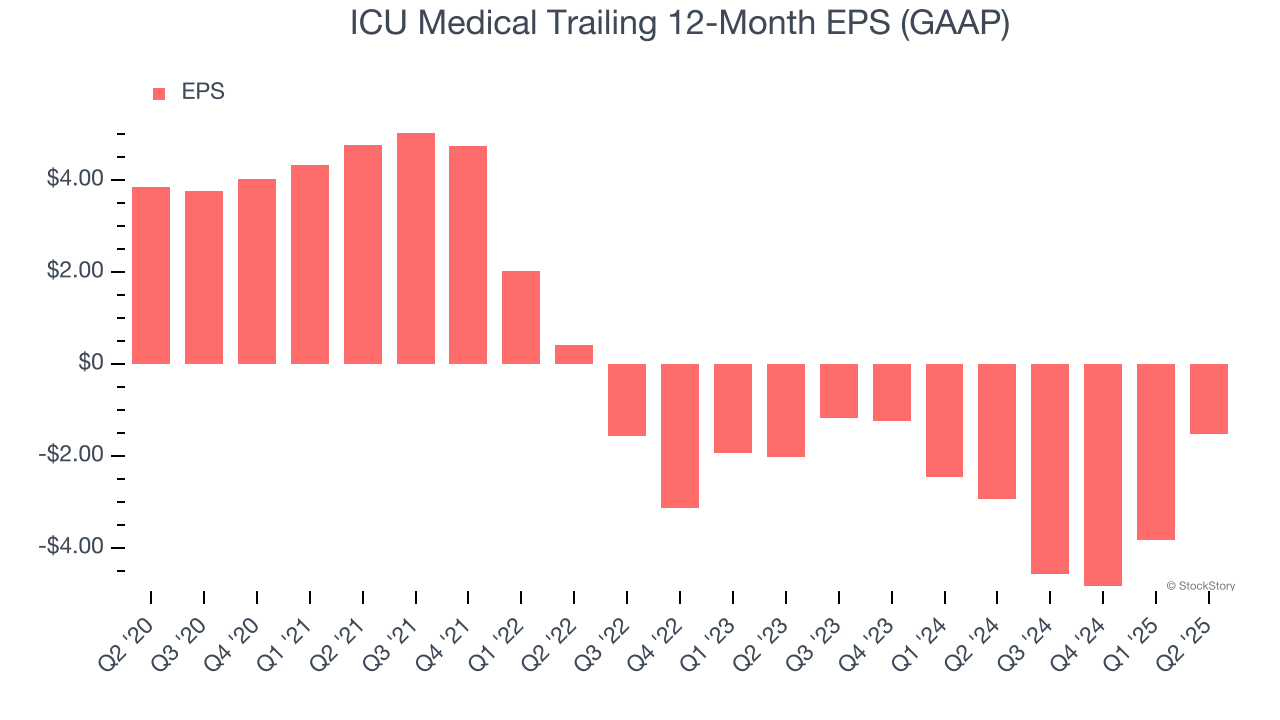
We can take a deeper look into ICU Medical’s earnings to better understand the drivers of its performance. As we mentioned earlier, ICU Medical’s operating margin declined by 4.6 percentage points over the last five years. Its share count also grew by 14.9%, meaning the company not only became less efficient with its operating expenses but also diluted its shareholders. 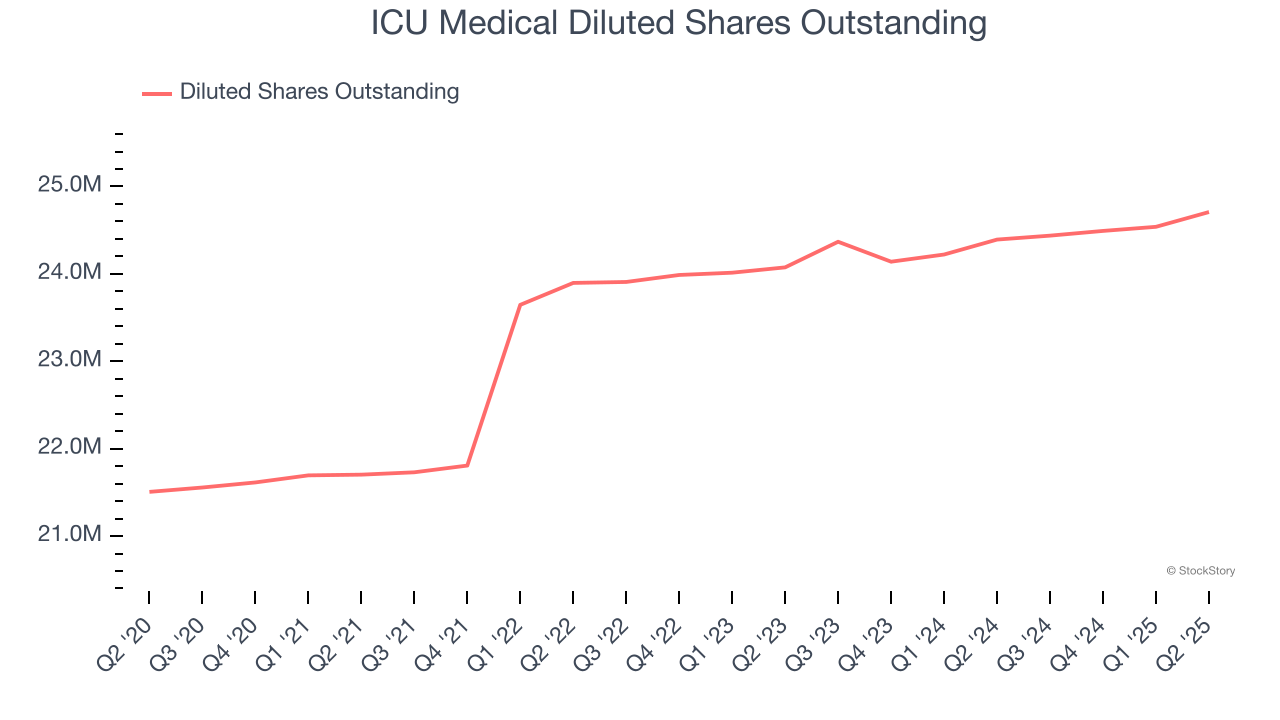
In Q2, ICU Medical reported EPS at $1.43, up from negative $0.88 in the same quarter last year. This print easily cleared analysts’ estimates, and shareholders should be content with the results. Over the next 12 months, Wall Street expects ICU Medical to improve its earnings losses. Analysts forecast its full-year EPS of negative $1.52 will advance to negative $1.02.
Key Takeaways from ICU Medical’s Q2 Results
We were impressed by how significantly ICU Medical blew past analysts’ EPS expectations this quarter. We were also excited its full-year EPS guidance outperformed Wall Street’s estimates by a wide margin. Zooming out, we think this was a good print with some key areas of upside. The market seemed to be hoping for more, and the stock traded down 1.7% to $128 immediately following the results.
Big picture, is ICU Medical a buy here and now? We think that the latest quarter is only one piece of the longer-term business quality puzzle. Quality, when combined with valuation, can help determine if the stock is a buy. We cover that in our actionable full research report which you can read here, it’s free.


