
Over the last six months, CBIZ’s shares have sunk to $57.94, producing a disappointing 15.6% loss - a stark contrast to the S&P 500’s 17.7% gain. This may have investors wondering how to approach the situation.
Following the pullback, is now an opportune time to buy CBZ? Find out in our full research report, it’s free.
Why Does CBZ Stock Spark Debate?
With over 120 offices across 33 states and a team of more than 6,700 professionals, CBIZ (NYSE: CBZ) provides accounting, tax, benefits, insurance brokerage, and advisory services to help small and mid-sized businesses manage their finances and operations.
Two Things to Like:
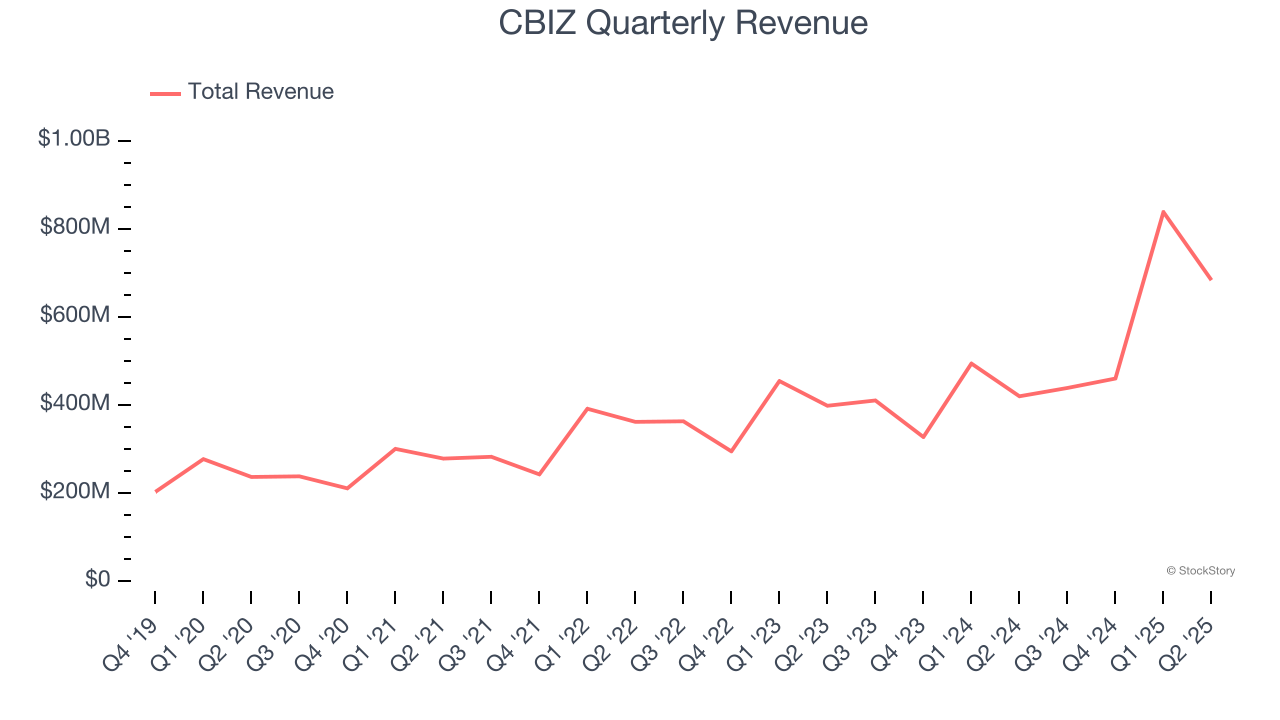
1. Skyrocketing Revenue Shows Strong Momentum
Reviewing a company’s long-term sales performance reveals insights into its quality. Even a bad business can shine for one or two quarters, but a top-tier one grows for years. Thankfully, CBIZ’s 22.5% annualized revenue growth over the last five years was incredible. Its growth beat the average business services company and shows its offerings resonate with customers.
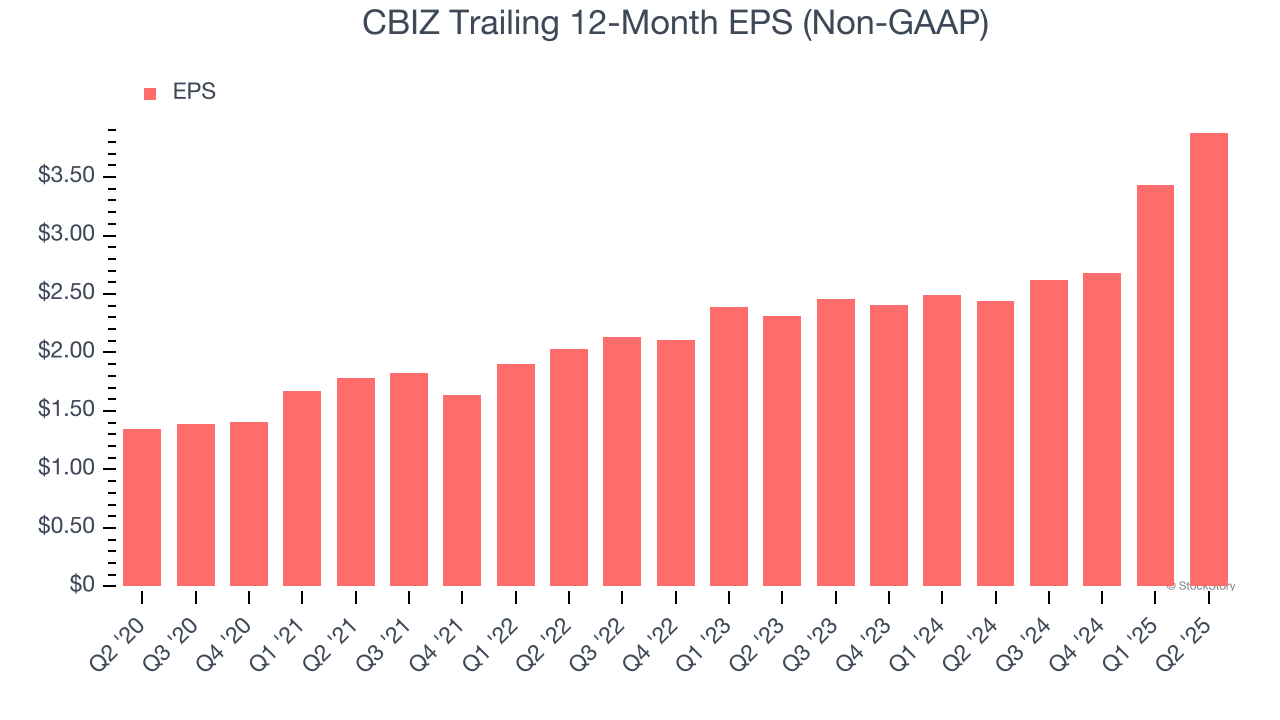
2. Outstanding Long-Term EPS Growth
Analyzing the long-term change in earnings per share (EPS) shows whether a company's incremental sales were profitable – for example, revenue could be inflated through excessive spending on advertising and promotions.
CBIZ’s astounding 23.5% annual EPS growth over the last five years aligns with its revenue performance. This tells us its incremental sales were profitable.
One Reason to be Careful:
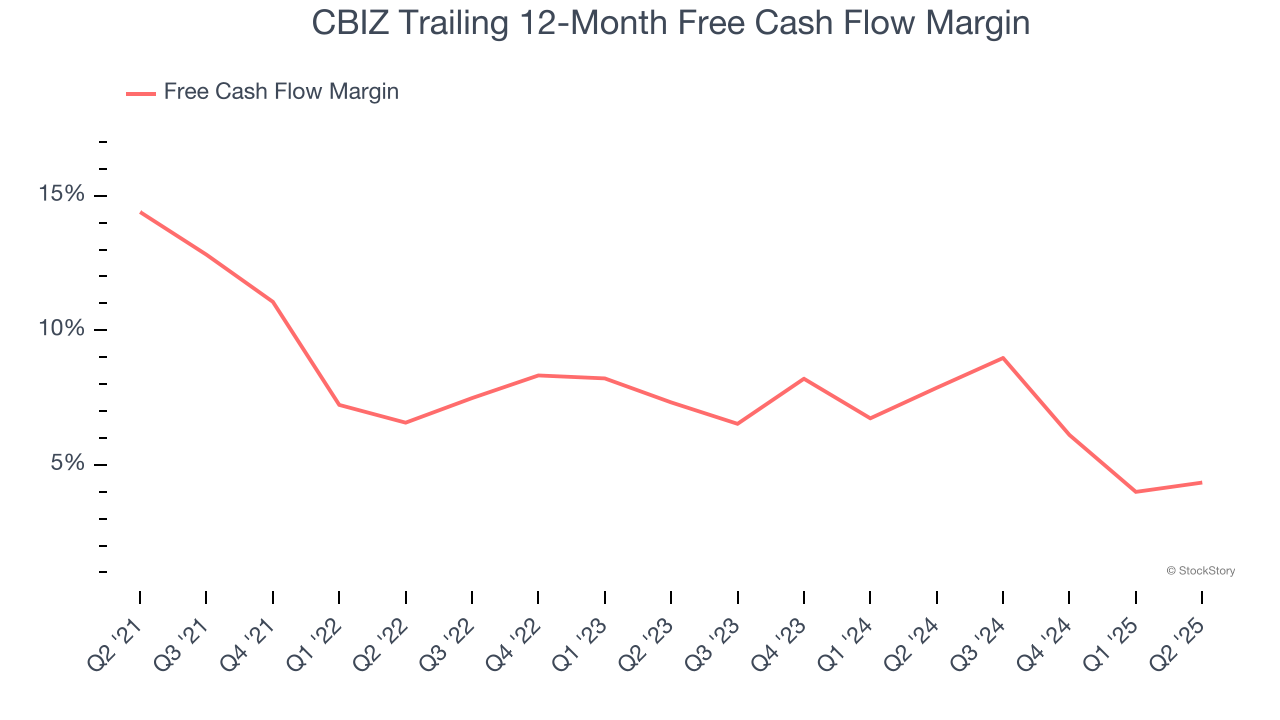
Free Cash Flow Margin Dropping
If you’ve followed StockStory for a while, you know we emphasize free cash flow. Why, you ask? We believe that in the end, cash is king, and you can’t use accounting profits to pay the bills.
As you can see below, CBIZ’s margin dropped by 10.1 percentage points over the last five years. If its declines continue, it could signal increasing investment needs and capital intensity. CBIZ’s free cash flow margin for the trailing 12 months was 4.3%.
Final Judgment
CBIZ has huge potential even though it has some open questions. After the recent drawdown, the stock trades at 15× forward P/E (or $57.94 per share). Is now a good time to buy? See for yourself in our in-depth research report, it’s free.
High-Quality Stocks for All Market Conditions
When Trump unveiled his aggressive tariff plan in April 2025, markets tanked as investors feared a full-blown trade war. But those who panicked and sold missed the subsequent rebound that’s already erased most losses.
Don’t let fear keep you from great opportunities and take a look at Top 6 Stocks for this week. This is a curated list of our High Quality stocks that have generated a market-beating return of 183% over the last five years (as of March 31st 2025).
Stocks that made our list in 2020 include now familiar names such as Nvidia (+1,545% between March 2020 and March 2025) as well as under-the-radar businesses like the once-micro-cap company Kadant (+351% five-year return). Find your next big winner with StockStory today.
StockStory is growing and hiring equity analyst and marketing roles. Are you a 0 to 1 builder passionate about the markets and AI? See the open roles here.