
Although MarineMax (currently trading at $25.25 per share) has gained 8.7% over the last six months, it has trailed the S&P 500’s 15.7% return during that period. This was partly due to its softer quarterly results and might have investors contemplating their next move.
Is there a buying opportunity in MarineMax, or does it present a risk to your portfolio? Dive into our full research report to see our analyst team’s opinion, it’s free.
Why Is MarineMax Not Exciting?
We're sitting this one out for now. Here are three reasons you should be careful with HZO and a stock we'd rather own.
1. Stores Are Closing, a Headwind for Revenue
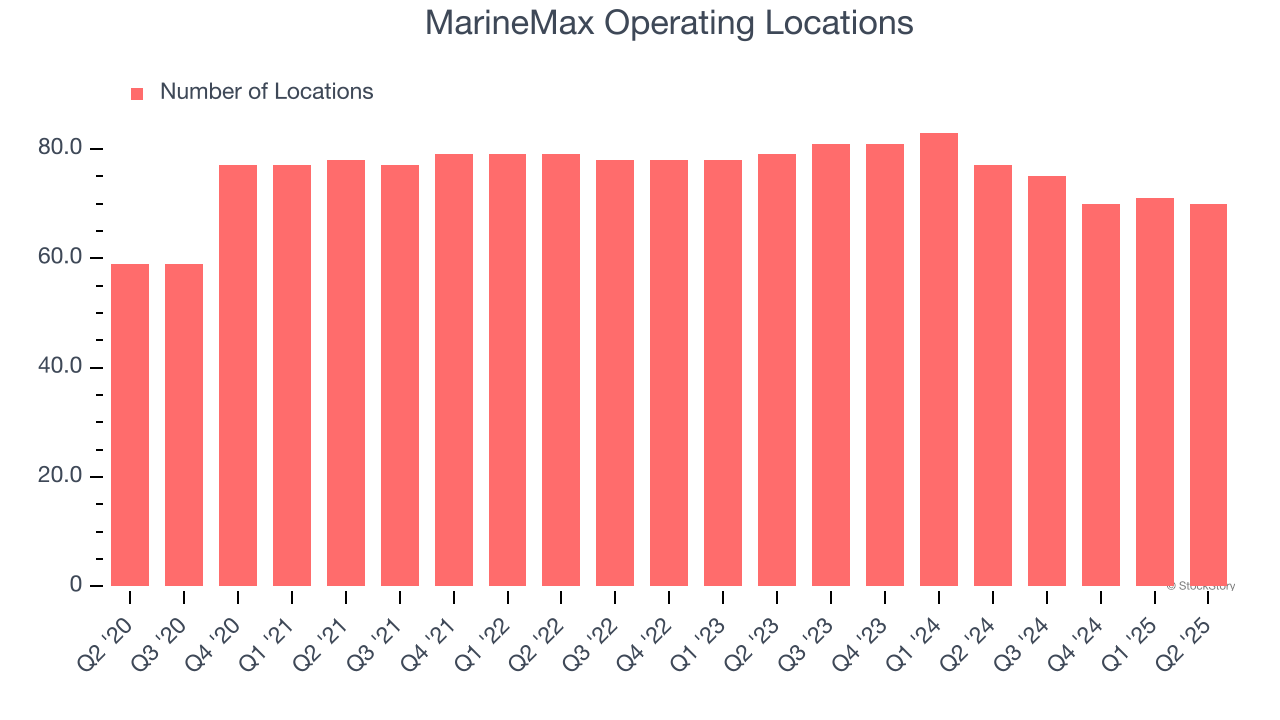
The number of stores a retailer operates is a critical driver of how quickly company-level sales can grow.
MarineMax operated 70 locations in the latest quarter. Over the last two years, the company has generally closed its stores, averaging 4.1% annual declines.
When a retailer shutters stores, it usually means that brick-and-mortar demand is less than supply, and it is responding by closing underperforming locations to improve profitability.
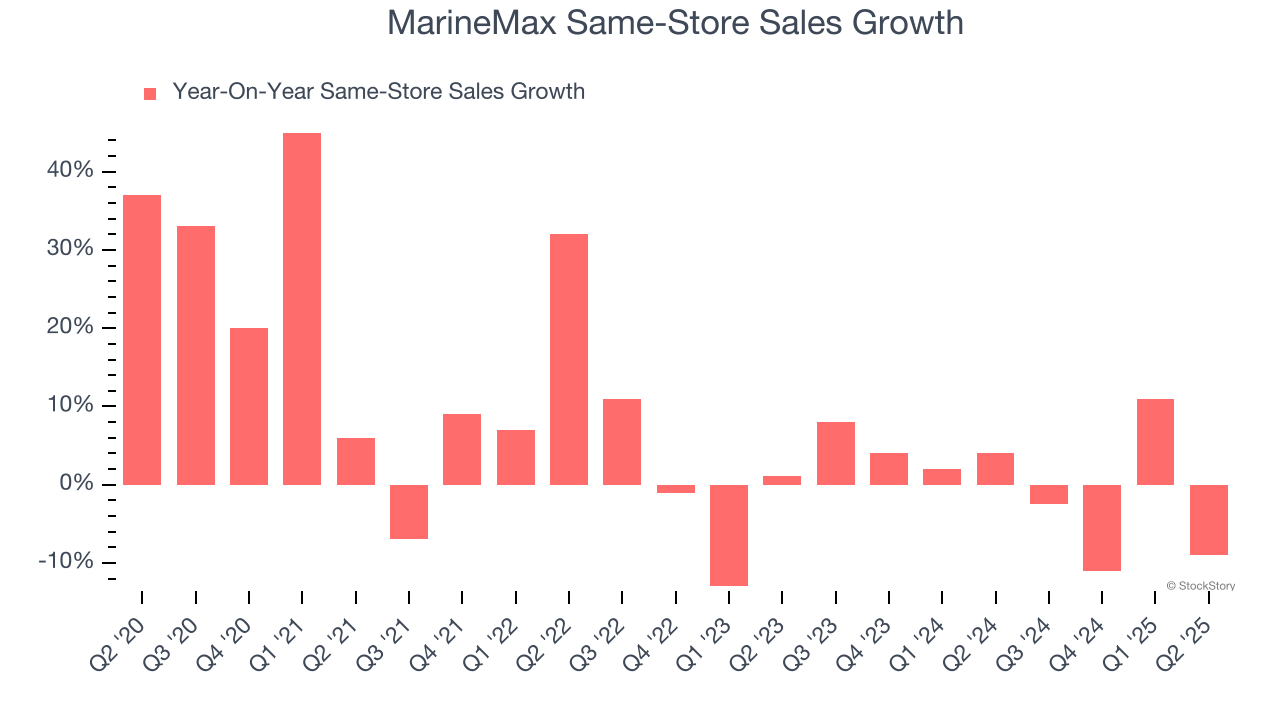
2. Flat Same-Store Sales Indicate Weak Demand
Same-store sales is an industry measure of whether revenue is growing at existing stores, and it is driven by customer visits (often called traffic) and the average spending per customer (ticket).
MarineMax’s demand within its existing locations has barely increased over the last two years as its same-store sales were flat.
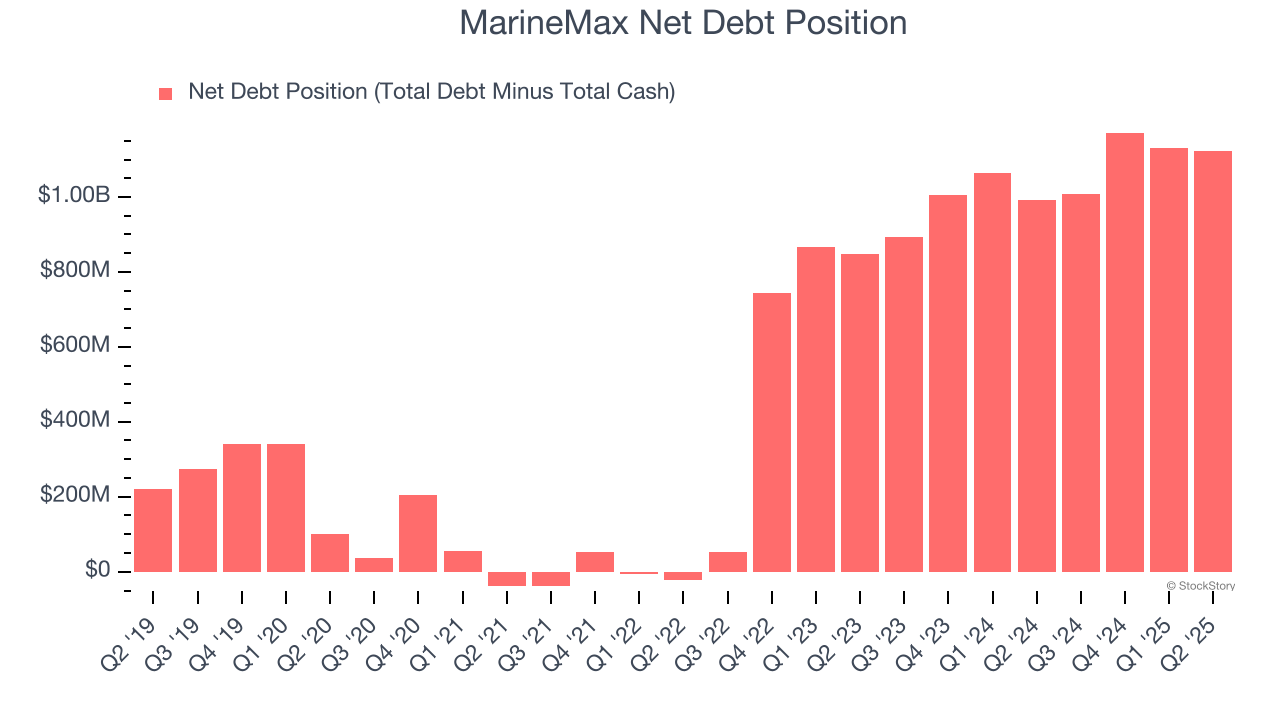
3. Short Cash Runway Exposes Shareholders to Potential Dilution
As long-term investors, the risk we care about most is the permanent loss of capital, which can happen when a company goes bankrupt or raises money from a disadvantaged position. This is separate from short-term stock price volatility, something we are much less bothered by.
MarineMax burned through $53.58 million of cash over the last year, and its $1.27 billion of debt exceeds the $151 million of cash on its balance sheet. This is a deal breaker for us because indebted loss-making companies spell trouble.
Unless the MarineMax’s fundamentals change quickly, it might find itself in a position where it must raise capital from investors to continue operating. Whether that would be favorable is unclear because dilution is a headwind for shareholder returns.
We remain cautious of MarineMax until it generates consistent free cash flow or any of its announced financing plans materialize on its balance sheet.
Final Judgment
MarineMax isn’t a terrible business, but it doesn’t pass our bar. With its shares trailing the market in recent months, the stock trades at 9.8× forward P/E (or $25.25 per share). While this valuation is optically cheap, the potential downside is big given its shaky fundamentals. We're fairly confident there are better investments elsewhere. Let us point you toward one of our top digital advertising picks.
Stocks We Like More Than MarineMax
When Trump unveiled his aggressive tariff plan in April 2025, markets tanked as investors feared a full-blown trade war. But those who panicked and sold missed the subsequent rebound that’s already erased most losses.
Don’t let fear keep you from great opportunities and take a look at Top 9 Market-Beating Stocks. This is a curated list of our High Quality stocks that have generated a market-beating return of 183% over the last five years (as of March 31st 2025).
Stocks that made our list in 2020 include now familiar names such as Nvidia (+1,545% between March 2020 and March 2025) as well as under-the-radar businesses like the once-micro-cap company Tecnoglass (+1,754% five-year return). Find your next big winner with StockStory today.
StockStory is growing and hiring equity analyst and marketing roles. Are you a 0 to 1 builder passionate about the markets and AI? See the open roles here.


