- Gold's Cash Index has gone parabolic this month, increasing 27% from December's settlement of $4,325.
- The Indexes daily chart shows gains of $100 to $200 becoming common as the market finds little resistance.
- Given Gold is THE safe-haven market, this historic rally by the Cash Index speaks volumes about the global economic and political situations at this time.
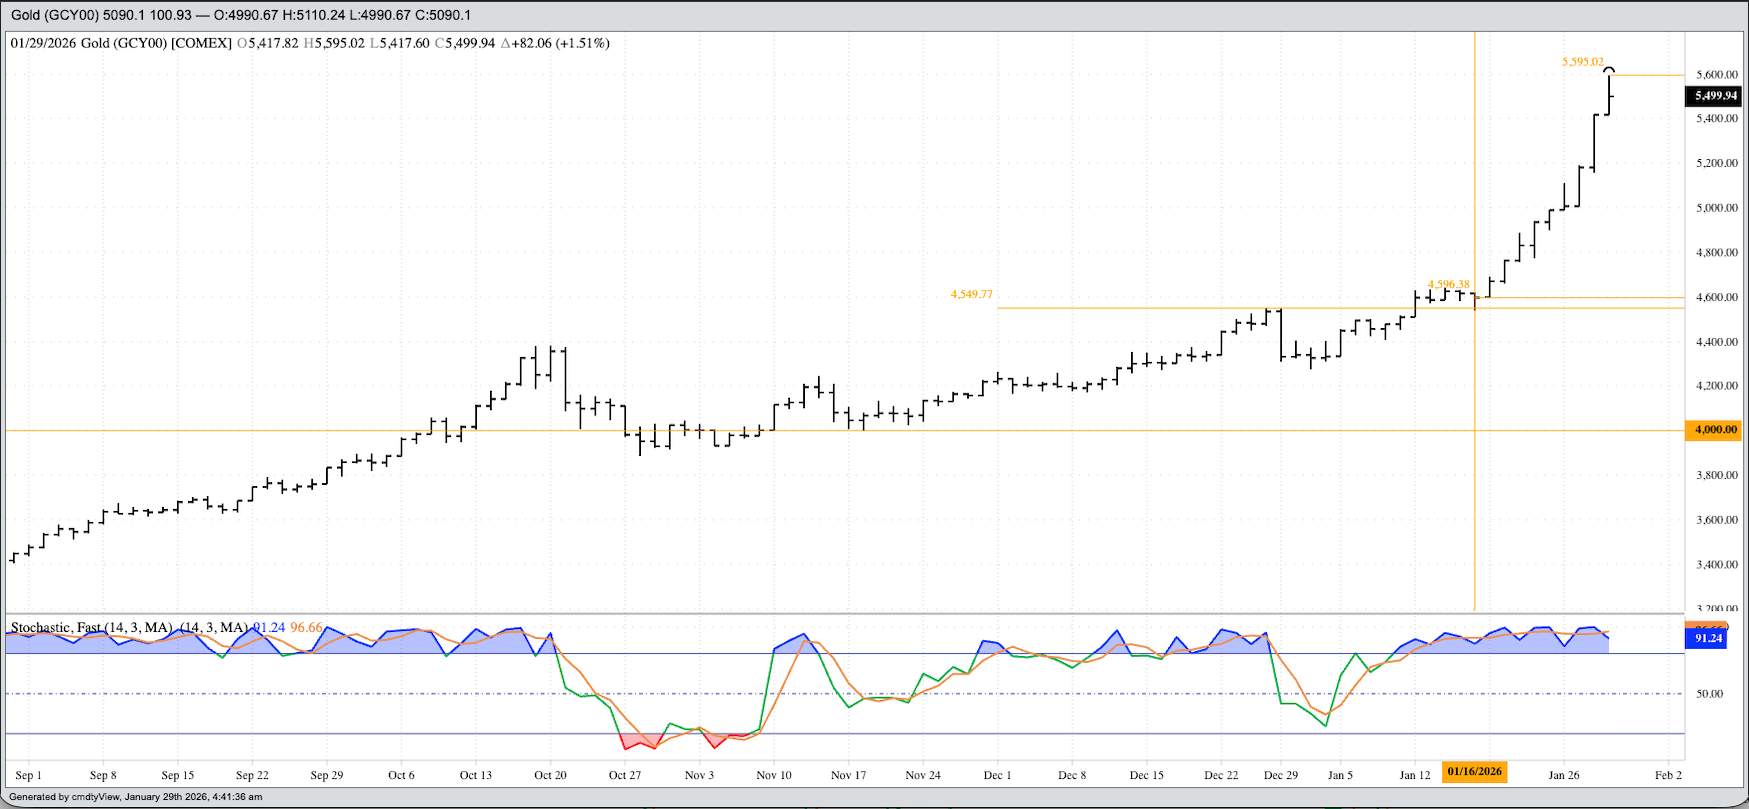
Last October, I wrote about how Gold’s Cash Index (GCY00) looked to be on the path to move beyond the $5,000 mark that month. It didn’t quite happen as the Index took a breather during November, but once we got through December and into the new year, the Index exploded, extending its historic run to a high of $5,595.02 overnight through early Thursday morning (January 29). A look at the Indexes daily chart – I’ll be talking about the Monthly Chart in my Investment Newsletter over the weekend – shows an incredible pattern since its latest downtick on January 16:
- Friday, January 16: The Index closed at $4,596, down $19.50 and just below the all-time high at the time of $4,642.75 from January 14.
- Monday, January 19: The Index took out $4,600 as it posted a new all-time high of $4,690
- Tuesday, January 20: The Index took out $4,700 on its way to a high of $4,766
- Wednesday, January 21: The Index took out $4,800, posting a high of $4,888
- Thursday, January 22: The Index took out $4,900 with a high of $4,940
- Friday, January 23: The Index drew near $5,000 with its high of $4,990 and close of $4,989 heading into the weekend
- Saturday and Sunday, January 24 and 25: We all know what happened in the US last weekend
- Monday, January 26: The Index took out both $5,000 and $5,100 with a high of $5,110
- Tuesday, January 27: The Index closed in on $5,200 with a high of $5,190
- Wednesday, January 28: The Index took out $5,200, $5,300, and $5,400 on its way to a high of $5,419
- Thursday, January 29: Pre-dawn finds the Index blew through $5,500 and nearly hit $5,600 with a high of $5,595
Gold is a safe-haven market, THE safe-haven market, meaning the higher it goes the less stable the world economic and political situation is becoming. What is the source of the instability? While this is a source of debate, the reality is the answer to the question is obvious. What does the future hold for Gold, if we apply my Market Rules again? Rule #1 tells us to not get crossways with the trend due to Newton’s First Law of Motion applied to markets: A trending market will stay in that trend until acted upon by an outside force. As of this writing, the trend is showing no sign of changing.
How soon until the Index hits $10,000? Nobody knows, but let’s apply some simple math:
- As mentioned above, the Index blew through $5,000 this past week.
- The Index doubled in price from October 2024 through January 2026, a span of roughly 15 months.
- 15 months from January 2026 is April 2027
- As of this writing, the Index is up 27% for the month and new year.
- If the Index averages gains of 25% per month, starting with the December 2025 settlement of $4,325
- Then the Index would be projected to take out $10,000 during April 2026
- There’s likely some complicated formula taking into account acceleration, but I’ll put that aside for now.
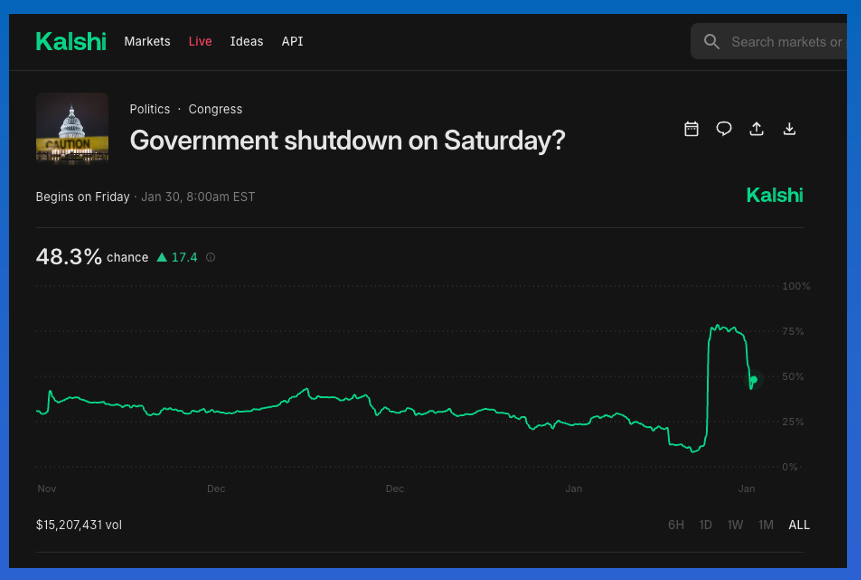
And we can't forget the US government is set to shut down at the end of January 2026, with Kalshi putting the odds earlier this week at 78%. However, this has dropped to 49% as of Thursday morning. I'm expecting continued volatility in the odds the next few days.
On the date of publication, Darin Newsom did not have (either directly or indirectly) positions in any of the securities mentioned in this article. All information and data in this article is solely for informational purposes. For more information please view the Barchart Disclosure Policy here.
More news from Barchart